Stock Ranking
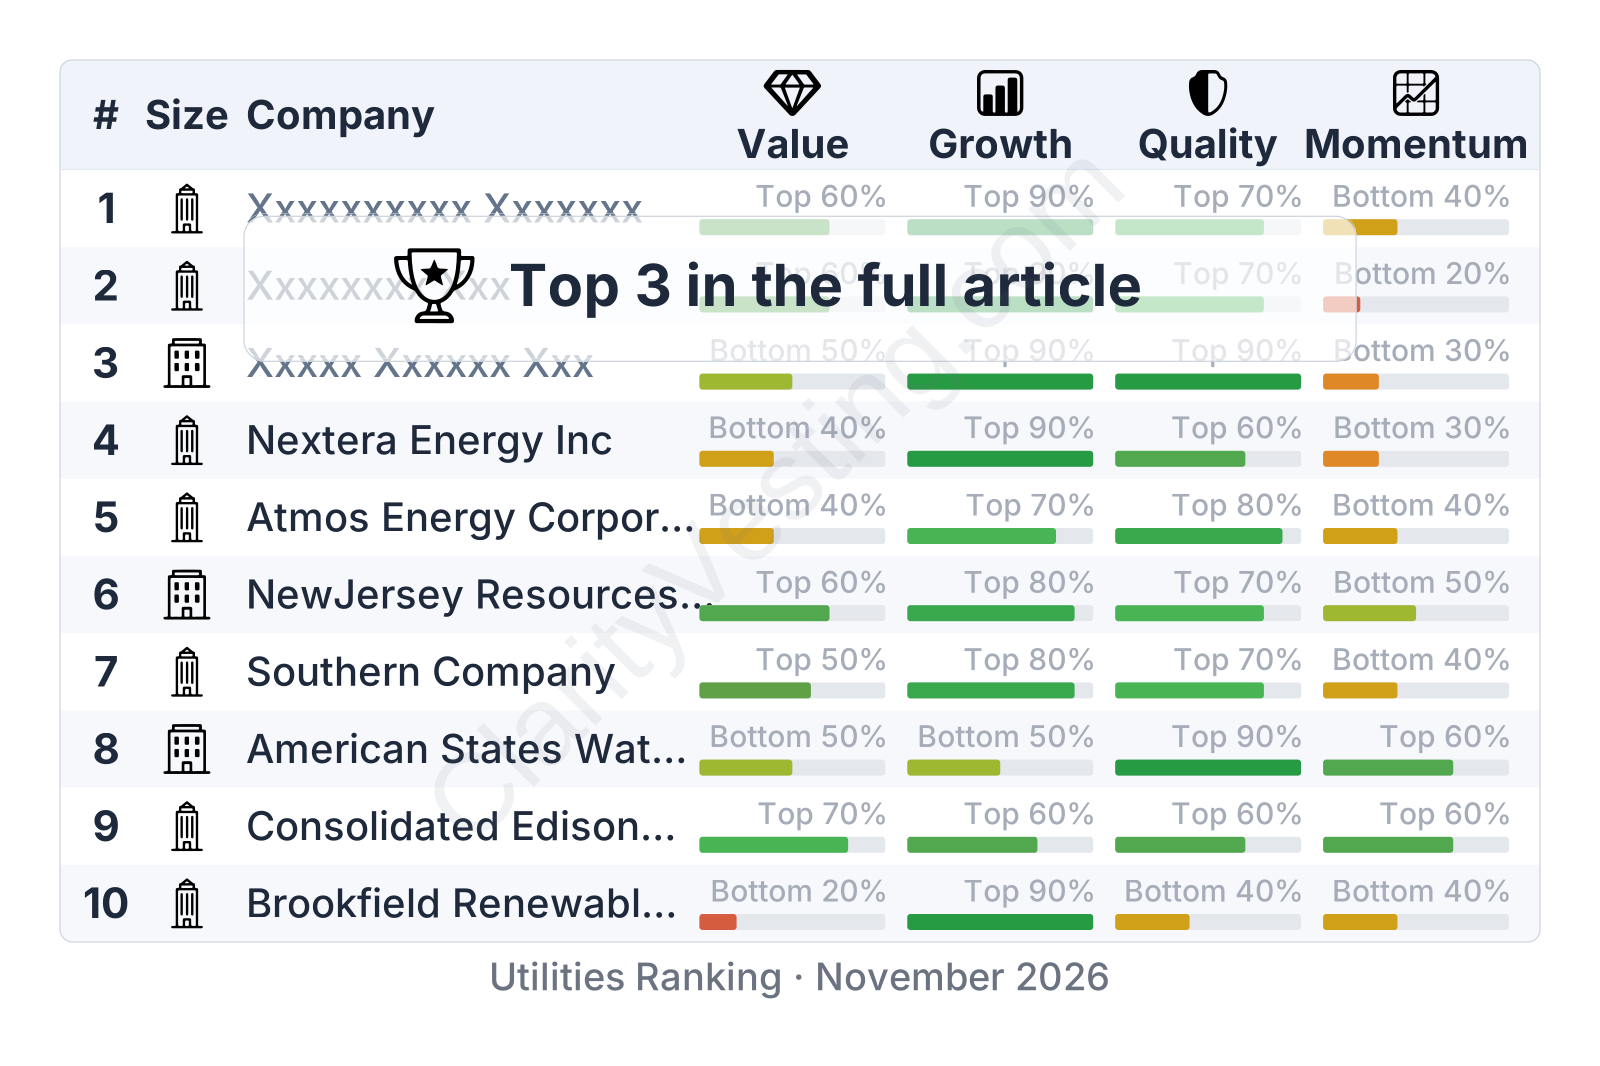
Utilities Stock Ranking · November 2026
Published 01 Nov 2026
•
Updated 01 Nov 2026
This sector ranking is based on quantitative metrics grouped into four factors:
Value : measures how expensive a stock is relative to the company’s fundamentalsGrowth : measures how quickly the business is expandingQuality : assesses business durability, with a focus on debt levels, margins, and return on invested capitalMomentum : analyzes the current direction and strength of the stock price trendCompanies with strong fundamentals have historically delivered superior long-term performance. However, quantitative metrics alone are not sufficient to evaluate a business. Understanding how a company operates, along with its catalysts and risks, provides a more complete picture.
Quantitative rankings should be used as a starting point for research rather than as standalone investment decisions.
The ranking includes companies across different market capitalizations. Smaller-cap stocks may offer stronger growth opportunities but generally carry higher volatility and business risk.
CopyRight:SVG Design Editor;
configurationStart;Unit=smInches;Dpi=96;Division=4;Grid=True;Zoom=5;CanvasW=122.304;CanvasH=192;configurationEnd;
Large cap
Brookfield Infrastructure Partners LP
+21%
5y price change
CopyRight:SVG Design Editor;
configurationStart;Unit=smInches;Dpi=96;Division=4;Grid=True;Zoom=5;CanvasW=240;CanvasH=192;configurationEnd;
Value
Top 50%
CopyRight:SVG Design Editor;
configurationStart;Unit=smInches;Dpi=96;Division=4;Grid=True;Zoom=5;CanvasW=193.728;CanvasH=192;configurationEnd;
Growth
Bottom 40%
CopyRight:SVG Design Editor;
configurationStart;Unit=smInches;Dpi=96;Division=4;Grid=True;Zoom=5;CanvasW=160.128;CanvasH=192;configurationEnd;
Quality
Top 70%
CopyRight:SVG Design Editor;
configurationStart;Unit=smInches;Dpi=96;Division=4;Grid=True;Zoom=5;CanvasW=192.672;CanvasH=192;configurationEnd;
Momentum
Top 70%
Sector Ranking
Catalysts
Data infra, capital recycling, grid
spend
Risks
High leverage, weak FCF, thin
margins
Sector: Utilities
ClarityVesting.com
Brookfield Infrastructure Partners owns essential global assets across utilities, transport, midstream, and data. Its scale, expanding revenue base, and exposure to long-duration infrastructure demand define the core appeal, while the platform model adds room for further growth.
Stock analysis Brookfield Infrastructure Partners LP
CopyRight:SVG Design Editor;
configurationStart;Unit=smInches;Dpi=96;Division=4;Grid=True;Zoom=5;CanvasW=122.304;CanvasH=192;configurationEnd;
Large cap
NiSource Inc
+111%
5y price change
CopyRight:SVG Design Editor;
configurationStart;Unit=smInches;Dpi=96;Division=4;Grid=True;Zoom=5;CanvasW=240;CanvasH=192;configurationEnd;
Value
Bottom 40%
CopyRight:SVG Design Editor;
configurationStart;Unit=smInches;Dpi=96;Division=4;Grid=True;Zoom=5;CanvasW=193.728;CanvasH=192;configurationEnd;
Growth
Top 70%
CopyRight:SVG Design Editor;
configurationStart;Unit=smInches;Dpi=96;Division=4;Grid=True;Zoom=5;CanvasW=160.128;CanvasH=192;configurationEnd;
Quality
Top 50%
CopyRight:SVG Design Editor;
configurationStart;Unit=smInches;Dpi=96;Division=4;Grid=True;Zoom=5;CanvasW=192.672;CanvasH=192;configurationEnd;
Momentum
Top 50%
Sector Ranking
Catalysts
Rate-base growth, grid upgrades
Risks
High leverage, negative free cash
flow
Sector: Utilities
ClarityVesting.com
NiSource runs regulated gas and electric utilities, giving it stable demand and a visible infrastructure-led growth path. Healthy margins and steady expansion stand out, while the analysis explores how financing needs and valuation shape the long-term picture.
Stock analysis NiSource Inc
CopyRight:SVG Design Editor;
configurationStart;Unit=smInches;Dpi=96;Division=4;Grid=True;Zoom=5;CanvasW=180.864;CanvasH=192;configurationEnd;
Mid cap
MGE Energy Inc
+9%
5y price change
CopyRight:SVG Design Editor;
configurationStart;Unit=smInches;Dpi=96;Division=4;Grid=True;Zoom=5;CanvasW=240;CanvasH=192;configurationEnd;
Value
Bottom 40%
CopyRight:SVG Design Editor;
configurationStart;Unit=smInches;Dpi=96;Division=4;Grid=True;Zoom=5;CanvasW=193.728;CanvasH=192;configurationEnd;
Growth
Top 50%
CopyRight:SVG Design Editor;
configurationStart;Unit=smInches;Dpi=96;Division=4;Grid=True;Zoom=5;CanvasW=160.128;CanvasH=192;configurationEnd;
Quality
Top 80%
CopyRight:SVG Design Editor;
configurationStart;Unit=smInches;Dpi=96;Division=4;Grid=True;Zoom=5;CanvasW=192.672;CanvasH=192;configurationEnd;
Momentum
Bottom 20%
Sector Ranking
Catalysts
Renewables buildout, rate base
growth
Risks
Rate rulings, Wisconsin
concentration
Sector: Utilities
ClarityVesting.com
MGE Energy is a Wisconsin regulated utility centered on electricity and natural gas delivery. Strong margins, lower-than-peer leverage, and ongoing clean energy investment give it a durable, infrastructure-backed profile.
Stock analysis MGE Energy Inc
CopyRight:SVG Design Editor;
configurationStart;Unit=smInches;Dpi=96;Division=4;Grid=True;Zoom=5;CanvasW=122.304;CanvasH=192;configurationEnd;
Large cap
Edison International
+18%
5y price change
CopyRight:SVG Design Editor;
configurationStart;Unit=smInches;Dpi=96;Division=4;Grid=True;Zoom=5;CanvasW=240;CanvasH=192;configurationEnd;
Value
Top 50%
CopyRight:SVG Design Editor;
configurationStart;Unit=smInches;Dpi=96;Division=4;Grid=True;Zoom=5;CanvasW=193.728;CanvasH=192;configurationEnd;
Growth
Top 80%
CopyRight:SVG Design Editor;
configurationStart;Unit=smInches;Dpi=96;Division=4;Grid=True;Zoom=5;CanvasW=160.128;CanvasH=192;configurationEnd;
Quality
Bottom 40%
CopyRight:SVG Design Editor;
configurationStart;Unit=smInches;Dpi=96;Division=4;Grid=True;Zoom=5;CanvasW=192.672;CanvasH=192;configurationEnd;
Momentum
Bottom 10%
Sector Ranking
Catalysts
Grid upgrades, California
electrification
Risks
Wildfire liability, high leverage
Sector: Utilities
ClarityVesting.com
Edison International is a California-focused electric utility built around Southern California Edison. Its regulated network, grid investment pipeline, and stronger profitability stand against a deeply discounted valuation that keeps attention on the broader setup.
Stock analysis Edison International
CopyRight:SVG Design Editor;
configurationStart;Unit=smInches;Dpi=96;Division=4;Grid=True;Zoom=5;CanvasW=122.304;CanvasH=192;configurationEnd;
Large cap
Dominion Energy Inc
+10%
5y price change
CopyRight:SVG Design Editor;
configurationStart;Unit=smInches;Dpi=96;Division=4;Grid=True;Zoom=5;CanvasW=240;CanvasH=192;configurationEnd;
Value
Top 50%
CopyRight:SVG Design Editor;
configurationStart;Unit=smInches;Dpi=96;Division=4;Grid=True;Zoom=5;CanvasW=193.728;CanvasH=192;configurationEnd;
Growth
Top 90%
CopyRight:SVG Design Editor;
configurationStart;Unit=smInches;Dpi=96;Division=4;Grid=True;Zoom=5;CanvasW=160.128;CanvasH=192;configurationEnd;
Quality
Bottom 40%
CopyRight:SVG Design Editor;
configurationStart;Unit=smInches;Dpi=96;Division=4;Grid=True;Zoom=5;CanvasW=192.672;CanvasH=192;configurationEnd;
Momentum
Top 70%
Sector Ranking
Catalysts
Virginia data centers, offshore
wind buildout
Risks
High leverage, negative free cash
flow
Sector: Utilities
ClarityVesting.com
Dominion Energy is a regulated utility centered on electric and gas infrastructure, with notable exposure to Virginia’s rising power demand and a major offshore wind project. Visible asset growth and solid margins help define its long-term business trajectory.
Stock analysis Dominion Energy Inc
CopyRight:SVG Design Editor;
configurationStart;Unit=smInches;Dpi=96;Division=4;Grid=True;Zoom=5;CanvasW=122.304;CanvasH=192;configurationEnd;
Large cap
Talen Energy Corporation
+638%
5y price change
CopyRight:SVG Design Editor;
configurationStart;Unit=smInches;Dpi=96;Division=4;Grid=True;Zoom=5;CanvasW=240;CanvasH=192;configurationEnd;
Value
Bottom 50%
CopyRight:SVG Design Editor;
configurationStart;Unit=smInches;Dpi=96;Division=4;Grid=True;Zoom=5;CanvasW=193.728;CanvasH=192;configurationEnd;
Growth
Top 90%
CopyRight:SVG Design Editor;
configurationStart;Unit=smInches;Dpi=96;Division=4;Grid=True;Zoom=5;CanvasW=160.128;CanvasH=192;configurationEnd;
Quality
Bottom 10%
CopyRight:SVG Design Editor;
configurationStart;Unit=smInches;Dpi=96;Division=4;Grid=True;Zoom=5;CanvasW=192.672;CanvasH=192;configurationEnd;
Momentum
Bottom 50%
Sector Ranking
Catalysts
Susquehanna data center demand, PJM
tightness
Risks
High leverage, profit volatility,
deal scrutiny
Sector: Utilities
ClarityVesting.com
Talen Energy is a merchant power producer centered on the Susquehanna nuclear plant, a valuable asset as U.S. electricity demand rises. Its profile is shaped by reliable generation, exposure to tighter power markets, and the potential to secure premium large-load contracts.
Stock analysis Talen Energy Corporation
CopyRight:SVG Design Editor;
configurationStart;Unit=smInches;Dpi=96;Division=4;Grid=True;Zoom=5;CanvasW=122.304;CanvasH=192;configurationEnd;
Large cap
Essential Utilities Inc
+8%
5y price change
CopyRight:SVG Design Editor;
configurationStart;Unit=smInches;Dpi=96;Division=4;Grid=True;Zoom=5;CanvasW=240;CanvasH=192;configurationEnd;
Value
Bottom 40%
CopyRight:SVG Design Editor;
configurationStart;Unit=smInches;Dpi=96;Division=4;Grid=True;Zoom=5;CanvasW=193.728;CanvasH=192;configurationEnd;
Growth
Top 60%
CopyRight:SVG Design Editor;
configurationStart;Unit=smInches;Dpi=96;Division=4;Grid=True;Zoom=5;CanvasW=160.128;CanvasH=192;configurationEnd;
Quality
Top 80%
CopyRight:SVG Design Editor;
configurationStart;Unit=smInches;Dpi=96;Division=4;Grid=True;Zoom=5;CanvasW=192.672;CanvasH=192;configurationEnd;
Momentum
Top 60%
Sector Ranking
Catalysts
Rate cases, water acquisitions,
capex base
Risks
Rate delays, debt costs, gas policy
risk
Sector: Utilities
ClarityVesting.com
Essential Utilities runs regulated water, wastewater, and gas networks with strong margins and a long runway for infrastructure investment. Essential-service stability and steady asset growth anchor the story, while its water focus and operating quality add to its distinctiveness.
Stock analysis Essential Utilities Inc
CopyRight:SVG Design Editor;
configurationStart;Unit=smInches;Dpi=96;Division=4;Grid=True;Zoom=5;CanvasW=122.304;CanvasH=192;configurationEnd;
Large cap
Constellation Energy Corp
+549%
5y price change
CopyRight:SVG Design Editor;
configurationStart;Unit=smInches;Dpi=96;Division=4;Grid=True;Zoom=5;CanvasW=240;CanvasH=192;configurationEnd;
Value
Bottom 50%
CopyRight:SVG Design Editor;
configurationStart;Unit=smInches;Dpi=96;Division=4;Grid=True;Zoom=5;CanvasW=193.728;CanvasH=192;configurationEnd;
Growth
Top 80%
CopyRight:SVG Design Editor;
configurationStart;Unit=smInches;Dpi=96;Division=4;Grid=True;Zoom=5;CanvasW=160.128;CanvasH=192;configurationEnd;
Quality
Bottom 40%
CopyRight:SVG Design Editor;
configurationStart;Unit=smInches;Dpi=96;Division=4;Grid=True;Zoom=5;CanvasW=192.672;CanvasH=192;configurationEnd;
Momentum
Bottom 40%
Sector Ranking
Catalysts
Data center demand, nuclear tax
credits
Risks
Power price swings, nuclear outages
Sector: Utilities
ClarityVesting.com
Constellation Energy is a major U.S. power producer built around a hard-to-replicate nuclear fleet. Rising electricity demand, clean-energy needs, and improving nuclear economics make it one of the utility sector’s more distinctive long-term businesses.
Stock analysis Constellation Energy Corp
CopyRight:SVG Design Editor;
configurationStart;Unit=smInches;Dpi=96;Division=4;Grid=True;Zoom=5;CanvasW=122.304;CanvasH=192;configurationEnd;
Large cap
American Electric Power Co Inc
+83%
5y price change
CopyRight:SVG Design Editor;
configurationStart;Unit=smInches;Dpi=96;Division=4;Grid=True;Zoom=5;CanvasW=240;CanvasH=192;configurationEnd;
Value
Top 50%
CopyRight:SVG Design Editor;
configurationStart;Unit=smInches;Dpi=96;Division=4;Grid=True;Zoom=5;CanvasW=193.728;CanvasH=192;configurationEnd;
Growth
Top 70%
CopyRight:SVG Design Editor;
configurationStart;Unit=smInches;Dpi=96;Division=4;Grid=True;Zoom=5;CanvasW=160.128;CanvasH=192;configurationEnd;
Quality
Bottom 50%
CopyRight:SVG Design Editor;
configurationStart;Unit=smInches;Dpi=96;Division=4;Grid=True;Zoom=5;CanvasW=192.672;CanvasH=192;configurationEnd;
Momentum
Top 60%
Sector Ranking
Catalysts
Transmission buildout, data center
demand
Risks
High leverage, rate case pressure
Sector: Utilities
ClarityVesting.com
American Electric Power is a major U.S. regulated utility with a powerful transmission network and visible infrastructure growth drivers. Grid investment, improving cash generation, and above-average margins strengthen its long-term business profile.
Stock analysis American Electric Power Co Inc
CopyRight:SVG Design Editor;
configurationStart;Unit=smInches;Dpi=96;Division=4;Grid=True;Zoom=5;CanvasW=180.864;CanvasH=192;configurationEnd;
Mid cap
Chesapeake Utilities Corporation
+14%
5y price change
CopyRight:SVG Design Editor;
configurationStart;Unit=smInches;Dpi=96;Division=4;Grid=True;Zoom=5;CanvasW=240;CanvasH=192;configurationEnd;
Value
Bottom 40%
CopyRight:SVG Design Editor;
configurationStart;Unit=smInches;Dpi=96;Division=4;Grid=True;Zoom=5;CanvasW=193.728;CanvasH=192;configurationEnd;
Growth
Top 60%
CopyRight:SVG Design Editor;
configurationStart;Unit=smInches;Dpi=96;Division=4;Grid=True;Zoom=5;CanvasW=160.128;CanvasH=192;configurationEnd;
Quality
Top 70%
CopyRight:SVG Design Editor;
configurationStart;Unit=smInches;Dpi=96;Division=4;Grid=True;Zoom=5;CanvasW=192.672;CanvasH=192;configurationEnd;
Momentum
Top 70%
Sector Ranking
Catalysts
Florida expansion, rate base
growth, RNG
Risks
Negative FCF, gas policy risk,
project delays
Sector: Utilities
ClarityVesting.com
Chesapeake Utilities runs regulated natural gas and energy infrastructure businesses with a growing presence in attractive regions such as Florida. Strong margins, steady expansion, and visible project pipelines support a long-term compounding profile.
Stock analysis Chesapeake Utilities Corporation
CopyRight:SVG Design Editor;
configurationStart;Unit=smInches;Dpi=96;Division=4;Grid=True;Zoom=5;CanvasW=122.304;CanvasH=192;configurationEnd;
Large cap
Brookfield Renewable Partners LP
-8%
5y price change
CopyRight:SVG Design Editor;
configurationStart;Unit=smInches;Dpi=96;Division=4;Grid=True;Zoom=5;CanvasW=240;CanvasH=192;configurationEnd;
Value
Bottom 20%
CopyRight:SVG Design Editor;
configurationStart;Unit=smInches;Dpi=96;Division=4;Grid=True;Zoom=5;CanvasW=193.728;CanvasH=192;configurationEnd;
Growth
Top 90%
CopyRight:SVG Design Editor;
configurationStart;Unit=smInches;Dpi=96;Division=4;Grid=True;Zoom=5;CanvasW=160.128;CanvasH=192;configurationEnd;
Quality
Bottom 40%
CopyRight:SVG Design Editor;
configurationStart;Unit=smInches;Dpi=96;Division=4;Grid=True;Zoom=5;CanvasW=192.672;CanvasH=192;configurationEnd;
Momentum
Bottom 40%
Sector Ranking
Catalysts
Data center power demand, dev
pipeline
Risks
High leverage, weak cash flow
Sector: Utilities
ClarityVesting.com
Brookfield Renewable Partners owns a global portfolio of hydro, wind, solar, and storage assets. Its scale, development pipeline, and exposure to rising clean-power demand make it a notable renewable infrastructure platform worth examining in depth.
Stock analysis Brookfield Renewable Partners LP
CopyRight:SVG Design Editor;
configurationStart;Unit=smInches;Dpi=96;Division=4;Grid=True;Zoom=5;CanvasW=122.304;CanvasH=192;configurationEnd;
Large cap
Consolidated Edison Inc
+81%
5y price change
CopyRight:SVG Design Editor;
configurationStart;Unit=smInches;Dpi=96;Division=4;Grid=True;Zoom=5;CanvasW=240;CanvasH=192;configurationEnd;
Value
Top 70%
CopyRight:SVG Design Editor;
configurationStart;Unit=smInches;Dpi=96;Division=4;Grid=True;Zoom=5;CanvasW=193.728;CanvasH=192;configurationEnd;
Growth
Top 60%
CopyRight:SVG Design Editor;
configurationStart;Unit=smInches;Dpi=96;Division=4;Grid=True;Zoom=5;CanvasW=160.128;CanvasH=192;configurationEnd;
Quality
Top 60%
CopyRight:SVG Design Editor;
configurationStart;Unit=smInches;Dpi=96;Division=4;Grid=True;Zoom=5;CanvasW=192.672;CanvasH=192;configurationEnd;
Momentum
Top 60%
Sector Ranking
Catalysts
NY grid upgrades, electrification
buildout
Risks
Rate case pressure, storm outages,
funding
Sector: Utilities
ClarityVesting.com
Con Edison runs essential electric, gas, and steam networks in the New York area, giving it a durable role in critical infrastructure. The analysis highlights steady regulated operations, improving cash flow, and a valuation that reflects stability more than rapid growth.
Stock analysis Consolidated Edison Inc
CopyRight:SVG Design Editor;
configurationStart;Unit=smInches;Dpi=96;Division=4;Grid=True;Zoom=5;CanvasW=180.864;CanvasH=192;configurationEnd;
Mid cap
American States Water Company
+6%
5y price change
CopyRight:SVG Design Editor;
configurationStart;Unit=smInches;Dpi=96;Division=4;Grid=True;Zoom=5;CanvasW=240;CanvasH=192;configurationEnd;
Value
Top 50%
CopyRight:SVG Design Editor;
configurationStart;Unit=smInches;Dpi=96;Division=4;Grid=True;Zoom=5;CanvasW=193.728;CanvasH=192;configurationEnd;
Growth
Bottom 50%
CopyRight:SVG Design Editor;
configurationStart;Unit=smInches;Dpi=96;Division=4;Grid=True;Zoom=5;CanvasW=160.128;CanvasH=192;configurationEnd;
Quality
Top 90%
CopyRight:SVG Design Editor;
configurationStart;Unit=smInches;Dpi=96;Division=4;Grid=True;Zoom=5;CanvasW=192.672;CanvasH=192;configurationEnd;
Momentum
Top 60%
Sector Ranking
Catalysts
Rate base growth, military
contracts
Risks
California regulation, capex
funding
Sector: Utilities
ClarityVesting.com
American States Water is a regulated water utility with a rare second engine: long-term military base utility contracts. Strong margins, lower-than-peer leverage, and essential-service demand give it an unusual long-duration business profile.
Stock analysis American States Water Company
CopyRight:SVG Design Editor;
configurationStart;Unit=smInches;Dpi=96;Division=4;Grid=True;Zoom=5;CanvasW=122.304;CanvasH=192;configurationEnd;
Large cap
Southern Company
+80%
5y price change
CopyRight:SVG Design Editor;
configurationStart;Unit=smInches;Dpi=96;Division=4;Grid=True;Zoom=5;CanvasW=240;CanvasH=192;configurationEnd;
Value
Top 50%
CopyRight:SVG Design Editor;
configurationStart;Unit=smInches;Dpi=96;Division=4;Grid=True;Zoom=5;CanvasW=193.728;CanvasH=192;configurationEnd;
Growth
Top 80%
CopyRight:SVG Design Editor;
configurationStart;Unit=smInches;Dpi=96;Division=4;Grid=True;Zoom=5;CanvasW=160.128;CanvasH=192;configurationEnd;
Quality
Top 60%
CopyRight:SVG Design Editor;
configurationStart;Unit=smInches;Dpi=96;Division=4;Grid=True;Zoom=5;CanvasW=192.672;CanvasH=192;configurationEnd;
Momentum
Bottom 50%
Sector Ranking
Catalysts
Georgia load growth, Vogtle ramp-up
Risks
High debt, weak free cash flow
Sector: Utilities
ClarityVesting.com
Southern Company is a major regulated utility serving fast-growing Southeastern markets through electric and gas networks. Completed nuclear expansion, strong margins, and rising grid demand support its long-range profile, while the analysis weighs how much leverage tempers that appeal.
Stock analysis Southern Company
CopyRight:SVG Design Editor;
configurationStart;Unit=smInches;Dpi=96;Division=4;Grid=True;Zoom=5;CanvasW=180.864;CanvasH=192;configurationEnd;
Mid cap
NewJersey Resources Corporation
+67%
5y price change
CopyRight:SVG Design Editor;
configurationStart;Unit=smInches;Dpi=96;Division=4;Grid=True;Zoom=5;CanvasW=240;CanvasH=192;configurationEnd;
Value
Top 60%
CopyRight:SVG Design Editor;
configurationStart;Unit=smInches;Dpi=96;Division=4;Grid=True;Zoom=5;CanvasW=193.728;CanvasH=192;configurationEnd;
Growth
Top 80%
CopyRight:SVG Design Editor;
configurationStart;Unit=smInches;Dpi=96;Division=4;Grid=True;Zoom=5;CanvasW=160.128;CanvasH=192;configurationEnd;
Quality
Top 70%
CopyRight:SVG Design Editor;
configurationStart;Unit=smInches;Dpi=96;Division=4;Grid=True;Zoom=5;CanvasW=192.672;CanvasH=192;configurationEnd;
Momentum
Bottom 50%
Sector Ranking
Catalysts
Rate-base growth, Utility customer
additions
Risks
Leverage, regulation, NJ gas
concentration
Sector: Utilities
ClarityVesting.com
NewJersey Resources is a New Jersey-focused gas utility with steadier earnings than its revenue swings imply. Better margins, regulated infrastructure investment, and improving profitability make it a useful example of durable utility economics.
Stock analysis NewJersey Resources Corporation
CopyRight:SVG Design Editor;
configurationStart;Unit=smInches;Dpi=96;Division=4;Grid=True;Zoom=5;CanvasW=122.304;CanvasH=192;configurationEnd;
Large cap
Atmos Energy Corporation
+108%
5y price change
CopyRight:SVG Design Editor;
configurationStart;Unit=smInches;Dpi=96;Division=4;Grid=True;Zoom=5;CanvasW=240;CanvasH=192;configurationEnd;
Value
Bottom 40%
CopyRight:SVG Design Editor;
configurationStart;Unit=smInches;Dpi=96;Division=4;Grid=True;Zoom=5;CanvasW=193.728;CanvasH=192;configurationEnd;
Growth
Top 70%
CopyRight:SVG Design Editor;
configurationStart;Unit=smInches;Dpi=96;Division=4;Grid=True;Zoom=5;CanvasW=160.128;CanvasH=192;configurationEnd;
Quality
Top 80%
CopyRight:SVG Design Editor;
configurationStart;Unit=smInches;Dpi=96;Division=4;Grid=True;Zoom=5;CanvasW=192.672;CanvasH=192;configurationEnd;
Momentum
Bottom 50%
Sector Ranking
Catalysts
Texas rate-base growth, pipeline
upgrades
Risks
Rate cases, gas policy, capex
funding
Sector: Utilities
ClarityVesting.com
Atmos Energy runs regulated natural gas utilities and pipelines, with most growth linked to infrastructure spending and expanding service territories. Rising earnings, strong margins, and lower leverage than many peers make it a notable example of a defensive utility business.
Stock analysis Atmos Energy Corporation
CopyRight:SVG Design Editor;
configurationStart;Unit=smInches;Dpi=96;Division=4;Grid=True;Zoom=5;CanvasW=122.304;CanvasH=192;configurationEnd;
Large cap
Nextera Energy Inc
+12%
5y price change
CopyRight:SVG Design Editor;
configurationStart;Unit=smInches;Dpi=96;Division=4;Grid=True;Zoom=5;CanvasW=240;CanvasH=192;configurationEnd;
Value
Bottom 40%
CopyRight:SVG Design Editor;
configurationStart;Unit=smInches;Dpi=96;Division=4;Grid=True;Zoom=5;CanvasW=193.728;CanvasH=192;configurationEnd;
Growth
Top 90%
CopyRight:SVG Design Editor;
configurationStart;Unit=smInches;Dpi=96;Division=4;Grid=True;Zoom=5;CanvasW=160.128;CanvasH=192;configurationEnd;
Quality
Top 60%
CopyRight:SVG Design Editor;
configurationStart;Unit=smInches;Dpi=96;Division=4;Grid=True;Zoom=5;CanvasW=192.672;CanvasH=192;configurationEnd;
Momentum
Bottom 30%
Sector Ranking
Catalysts
Florida growth, renewables pipeline
Risks
High debt, rate sensitivity
Sector: Utilities
ClarityVesting.com
NextEra Energy pairs a fast-growing Florida utility with one of the largest clean-energy platforms in the U.S. That combination brings unusual scale, healthy margins, and several avenues for expansion, setting it apart from more traditional utilities.
Stock analysis Nextera Energy Inc
This article is for informational purposes only and does not constitute financial advice. Some content is AI-generated. See Disclaimer