Stock Analysis · Dominion Energy Inc (D)
Overview
Dominion Energy is a large regulated utility focused on electricity and natural gas infrastructure in the United States. Its core business is relatively straightforward: it generates, transmits, and distributes electricity, delivers natural gas, and earns most of its money through state-regulated utility rates. That matters for long-term analysis because regulated utilities usually operate with more predictable demand than most industries, even if their growth tends to be moderate and capital needs are heavy.
Following its asset reshaping over the past several years, Dominion is now more concentrated around regulated operations, especially in Virginia, the Carolinas, and its contracted offshore wind project. In practical terms, the company is less exposed to commodity-sensitive operations than many energy companies and more tied to approved investment plans, grid reliability work, and customer growth in its service territories.
The main sources of revenue are spread across a few reporting lines, although exact percentages can move from year to year based on weather, fuel recovery, and regulation. Based on the company’s recent segment structure, the business is primarily driven by:
- Dominion Energy Virginia: the largest contributor, incorporating regulated electric generation, transmission, and distribution in Virginia.
- South Carolina electric and gas utilities: regulated electricity and natural gas service operations, mainly through Dominion Energy South Carolina.
- Contracted energy and other regulated infrastructure: including long-lived contracted and regulated assets, with offshore wind becoming increasingly important as capital is deployed.
At a high level, electric utility operations appear to represent the clear majority of earnings and asset value, while gas distribution and smaller contracted activities account for the remaining share. Revenue itself can be less informative than earnings mix for utilities because fuel and purchased power can pass through customer bills with limited impact on profit.
Over the last several years, total revenue has generally moved upward, while operating income recovered strongly after a weak 2022. Net income also improved, but interest expense has risen materially as the company carries a large debt load and operates in a higher-rate environment. That pattern is common for capital-intensive utilities, but it is especially relevant for Dominion because the company is investing heavily in major projects.
The business mix has become more centered on regulated and contracted cash-generating assets. Revenue has climbed from roughly $11 billion in 2021 to more than $16 billion in 2025, while operating income has rebounded more sharply than sales. The main offset is higher interest expense, which shows how much financing conditions matter for this company.
Key Figures
| Metric | Value | Sector ⓘ |
|---|---|---|
| Date | Oct 17, 2026 | |
| Context | ||
| Sector | Utilities | |
| Industry | Utilities - Regulated Electric | |
| Market Cap ⓘ | $54.79B | |
| Beta ⓘ | 0.62 | |
Value (Cheapness) | ||
| P/E Ratio ⓘ | 21.56 | 17.28 |
| P/B Ratio ⓘ | 2.29 | 1.51 |
| FCF Yield ⓘ | -12.46% | 0.65% |
| Dividend Yield ⓘ | 4.28% | 3.77% |
| EBIT / EV ⓘ | 4.66% | 5.01% |
| PEG ⓘ | 2.38 | |
Growth (Business expansion) | ||
| Revenue Growth ⓘ | 17.60% | 6.10% |
| RPS Growth (5Y CAGR) ⓘ | 8.12% | 3.87% |
| EPS Growth (5Y CAGR) ⓘ | -20.90% | -11.30% |
| BVPS Growth (5Y CAGR) ⓘ | -2.16% | 4.23% |
| Margin Growth (5Y Trend) ⓘ | 11.31% | 3.57% |
| FCF Growth (5Y CAGR) ⓘ | N/A | -8.84% |
| DPS Growth (5Y CAGR) ⓘ | 1.41% | 4.84% |
Quality (Business durability) | ||
| ROIC (Latest) ⓘ | 5.53% | 6.53% |
| ROA (Latest) ⓘ | 2.19% | 3.20% |
| ROIC (5Y Median) ⓘ | 4.92% | 5.95% |
| ROA (5Y Median) ⓘ | 2.01% | 2.75% |
| Net Debt / EBIT (Latest) ⓘ | 10.56 | 7.13 |
| Net Debt / EBIT (5Y Median) ⓘ | 10.18 | 7.23 |
| Net Debt / EBITDA (Latest) ⓘ | 6.95 | 4.31 |
| Net Debt / Assets ⓘ | 43.59% | 38.42% |
| EBITDA / Interest ⓘ | 3.58 | 4.58 |
| Operating Margin (Latest) ⓘ | 27.46% | 20.83% |
| Operating Margin (5Y Median) ⓘ | 28.14% | 20.08% |
| Debt to Equity (Latest) ⓘ | 184.72% | 137.69% |
| Profit Margin (Latest) ⓘ | 13.98% | 11.37% |
| Free Cash Flow (Latest) ⓘ | -$6.83B | |
Momentum (Price trend) | ||
| 3Y Return ⓘ | +72.69% | +52.37% |
| 12M Return (excl. last month) ⓘ | +11.93% | +8.84% |
| 6M Return ⓘ | +0.56% | -3.95% |
| Price vs. 200-Day MA ⓘ | -1.04% | -0.79% |
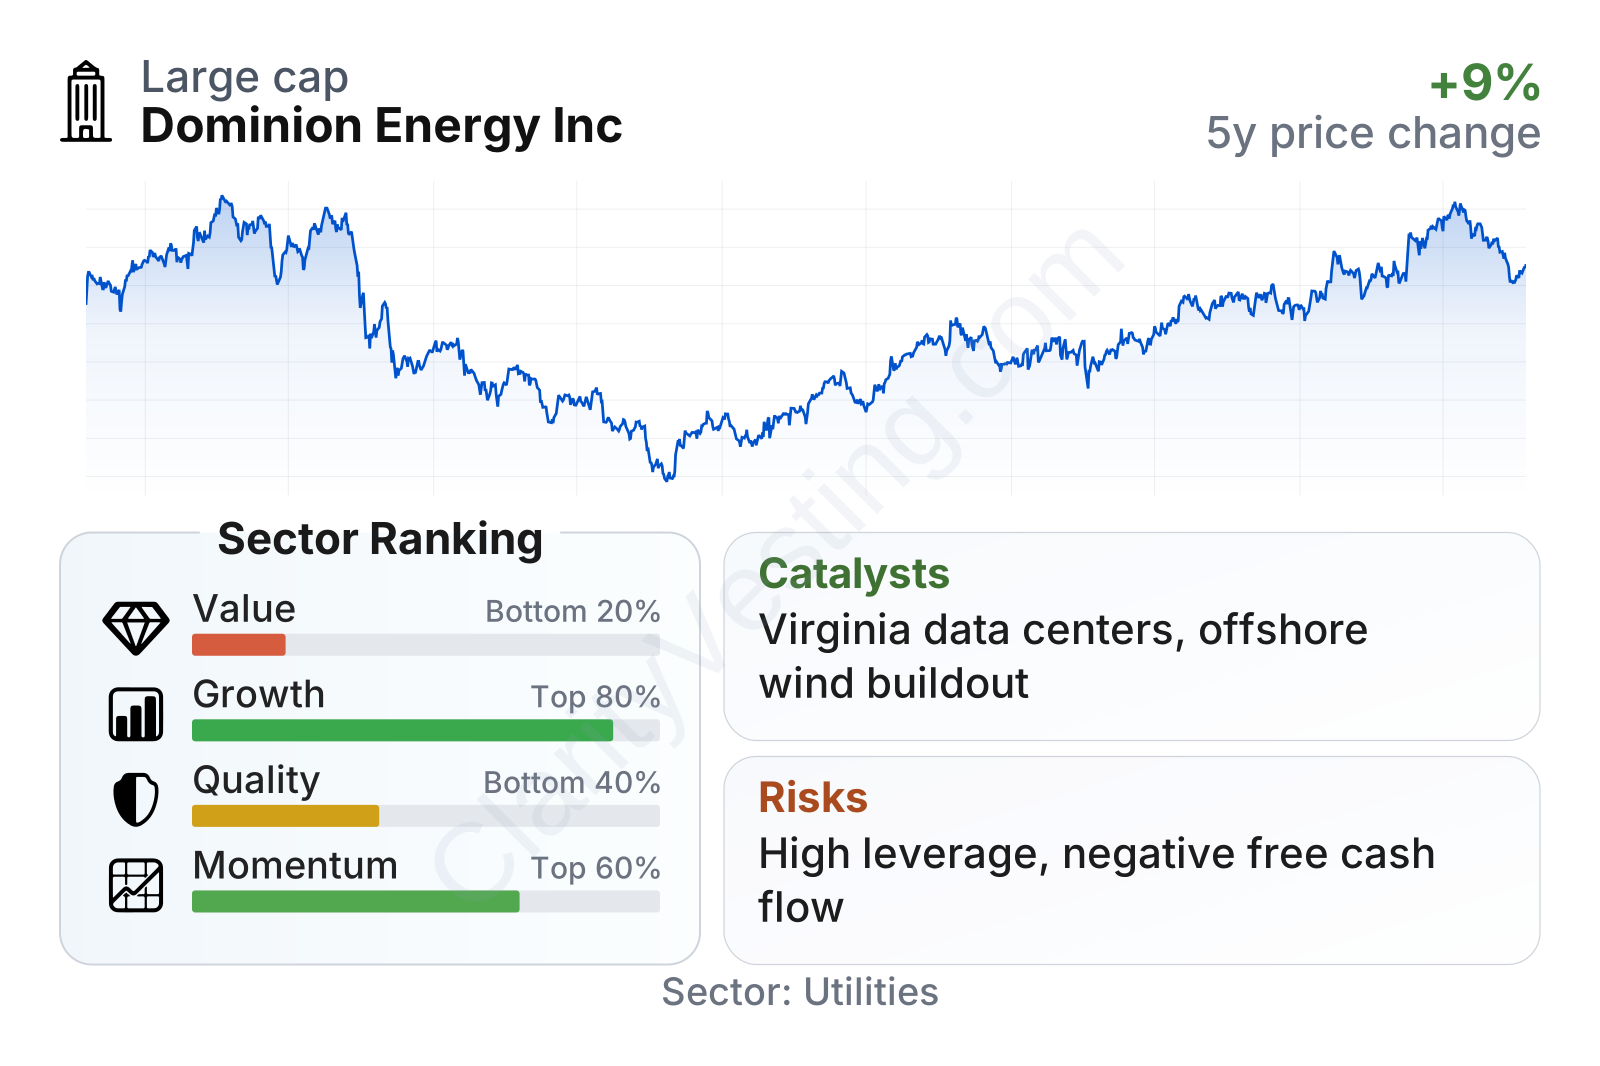
Dominion is a very large utility with relatively low share-price volatility, reflected in a beta well below 1. In growth, it screens better than much of the utility sector, helped by stronger recent revenue expansion and improving operating margins. The weaker areas are valuation and balance-sheet-related quality metrics: the stock trades above sector median multiples, free cash flow is deeply negative, and leverage is heavier than typical peers.
The stock’s path over the last several years shows a sharp drop through 2023 followed by a meaningful recovery into 2026. That rebound suggests the market has become more comfortable with the company’s earnings profile and strategic direction, but it also means the valuation is less obviously discounted than it was during the trough.
Growth
Dominion operates in a sector that is not fast-growing in the way technology or biotech can be, but it does have durable long-term demand drivers. Electric utilities are seeing more investment needs from population growth in certain regions, grid modernization, renewable integration, resilience spending, and rising power demand from data centers and electrification. For Dominion, that backdrop is particularly relevant because Virginia is one of the most important data center markets in the United States, especially in Northern Virginia.
The company’s strategy is built around expanding its regulated asset base. For a utility, that is the central engine of long-term growth: when management invests in transmission lines, generation, offshore wind, and distribution upgrades, those assets can eventually support higher allowed earnings if regulators approve recovery. This model tends to create steadier, more visible growth than cyclical industries, but it also requires large upfront spending.
Revenue per share has trended higher over the last five years, showing that Dominion has been growing its business base even while reshaping the portfolio. The pace has been stronger than the sector median over five years, which supports the view that the company’s regulated investment plan is translating into business expansion.
A major catalyst is the Coastal Virginia Offshore Wind project, one of the largest offshore wind developments in the country. It is strategically important not only because of its size, but because it expands Dominion’s regulated asset base for many years. Beyond offshore wind, the company continues to invest in transmission, grid hardening, and generation modernization. These projects are closely tied to reliability and power demand, making them more central to the utility system than optional growth bets.
Another favorable element is customer and demand growth in Dominion’s service areas, particularly where data center development is increasing electricity needs. Utilities with exposure to faster-growing demand territories can stand apart from slower-growth peers whose earnings depend mostly on rate increases rather than system expansion.
The tradeoff is clear in cash flow. Free cash flow remains deeply negative because Dominion is spending heavily on long-lived infrastructure. For a utility, negative free cash flow during a buildout is not unusual on its own, but it does mean future growth depends on timely project execution, financing access, and regulatory recovery.
Recent company updates have continued to emphasize large capital investment plans and demand strength in core service territories. In Dominion’s case, the long-term opportunity is less about sudden disruption and more about converting population growth, electrification, and transmission needs into a larger regulated earnings base.
Risks
This article is for informational purposes only and does not constitute financial advice. Some content is AI-generated. See Disclaimer


