Stock Analysis · Bulkers Ltd (TTBKF)
Overview
Bulkers Ltd is a marine shipping company focused on transporting dry bulk commodities. In simple terms, it owns and operates vessels that carry large unpackaged cargoes such as iron ore, coal, grain, and other raw materials used across industry, energy, and agriculture. The business is part of the global dry bulk shipping market, a segment that is highly sensitive to freight rates, vessel supply, fuel costs, and international trade flows.
Its revenue mainly comes from chartering out its vessels. Based on the company’s filings and operating profile, the business is largely concentrated in one core activity rather than spread across many divisions.
- Vessel charter revenue: approximately 100% of total revenue. This includes income earned from dry bulk vessels operating under time charters, voyage charters, and related shipping arrangements.
This concentration makes the company easy to understand, but it also means results depend heavily on shipping market conditions. Over the last several years, revenue has moved in a wide range, from roughly $114 million in 2021 to about $65 million in 2025, showing how cyclical this business can be. At the same time, the profit structure has often remained unusually strong for the sector, helped by operating leverage and periods of favorable charter economics.
The operating flow also shows a notable pattern: revenue has generally come down from the 2021 peak, but costs have remained relatively contained, allowing profitability to stay high. That helps explain why earnings can look much stronger than top-line trends alone would suggest.
Key Figures
| Metric | Value | Sector ⓘ |
|---|---|---|
| Date | Oct 22, 2026 | |
| Context | ||
| Sector | Industrials | |
| Industry | Marine Shipping | |
| Market Cap ⓘ | $1.14B | |
| Beta ⓘ | -0.08 | |
Value (Cheapness) | ||
| P/E Ratio ⓘ | 0.10 | 22.29 |
| P/B Ratio ⓘ | 4.04 | 1.98 |
| FCF Yield ⓘ | 2.79% | 6.26% |
| Dividend Yield ⓘ | 129.21% | 1.92% |
| EBIT / EV ⓘ | 2607.64% | 4.83% |
| PEG ⓘ | N/A | |
Growth (Business expansion) | ||
| Revenue Growth ⓘ | 110.90% | 9.30% |
| RPS Growth (5Y CAGR) ⓘ | -13.39% | 7.76% |
| EPS Growth (5Y CAGR) ⓘ | 23.11% | -13.17% |
| BVPS Growth (5Y CAGR) ⓘ | -0.97% | 6.13% |
| Margin Growth (5Y Trend) ⓘ | -13.49% | 0.74% |
| FCF Growth (5Y CAGR) ⓘ | -19.83% | 10.79% |
| DPS Growth (5Y CAGR) ⓘ | -18.81% | 9.41% |
Quality (Business durability) | ||
| ROIC (Latest) ⓘ | 99.09% | 10.75% |
| ROA (Latest) ⓘ | 154.71% | 5.41% |
| ROIC (5Y Median) ⓘ | 13.75% | 9.37% |
| ROA (5Y Median) ⓘ | 11.31% | 4.95% |
| Net Debt / EBIT (Latest) ⓘ | -0.02 | 2.04 |
| Net Debt / EBIT (5Y Median) ⓘ | 2.66 | 2.27 |
| Net Debt / EBITDA (Latest) ⓘ | -0.02 | 1.39 |
| Net Debt / Assets ⓘ | -83.33% | 19.27% |
| EBITDA / Interest ⓘ | 40.75 | 9.58 |
| Operating Margin (Latest) ⓘ | 92.37% | 10.49% |
| Operating Margin (5Y Median) ⓘ | 55.31% | 10.30% |
| Debt to Equity (Latest) ⓘ | N/A | 64.82% |
| Profit Margin (Latest) ⓘ | 89.13% | 6.67% |
| Free Cash Flow (Latest) ⓘ | $31.85M | |
Momentum (Price trend) | ||
| 3Y Return ⓘ | -84.52% | +67.77% |
| 12M Return (excl. last month) ⓘ | -93.11% | +12.05% |
| 6M Return ⓘ | -93.55% | 0.00% |
| Price vs. 200-Day MA ⓘ | -82.72% | +0.67% |
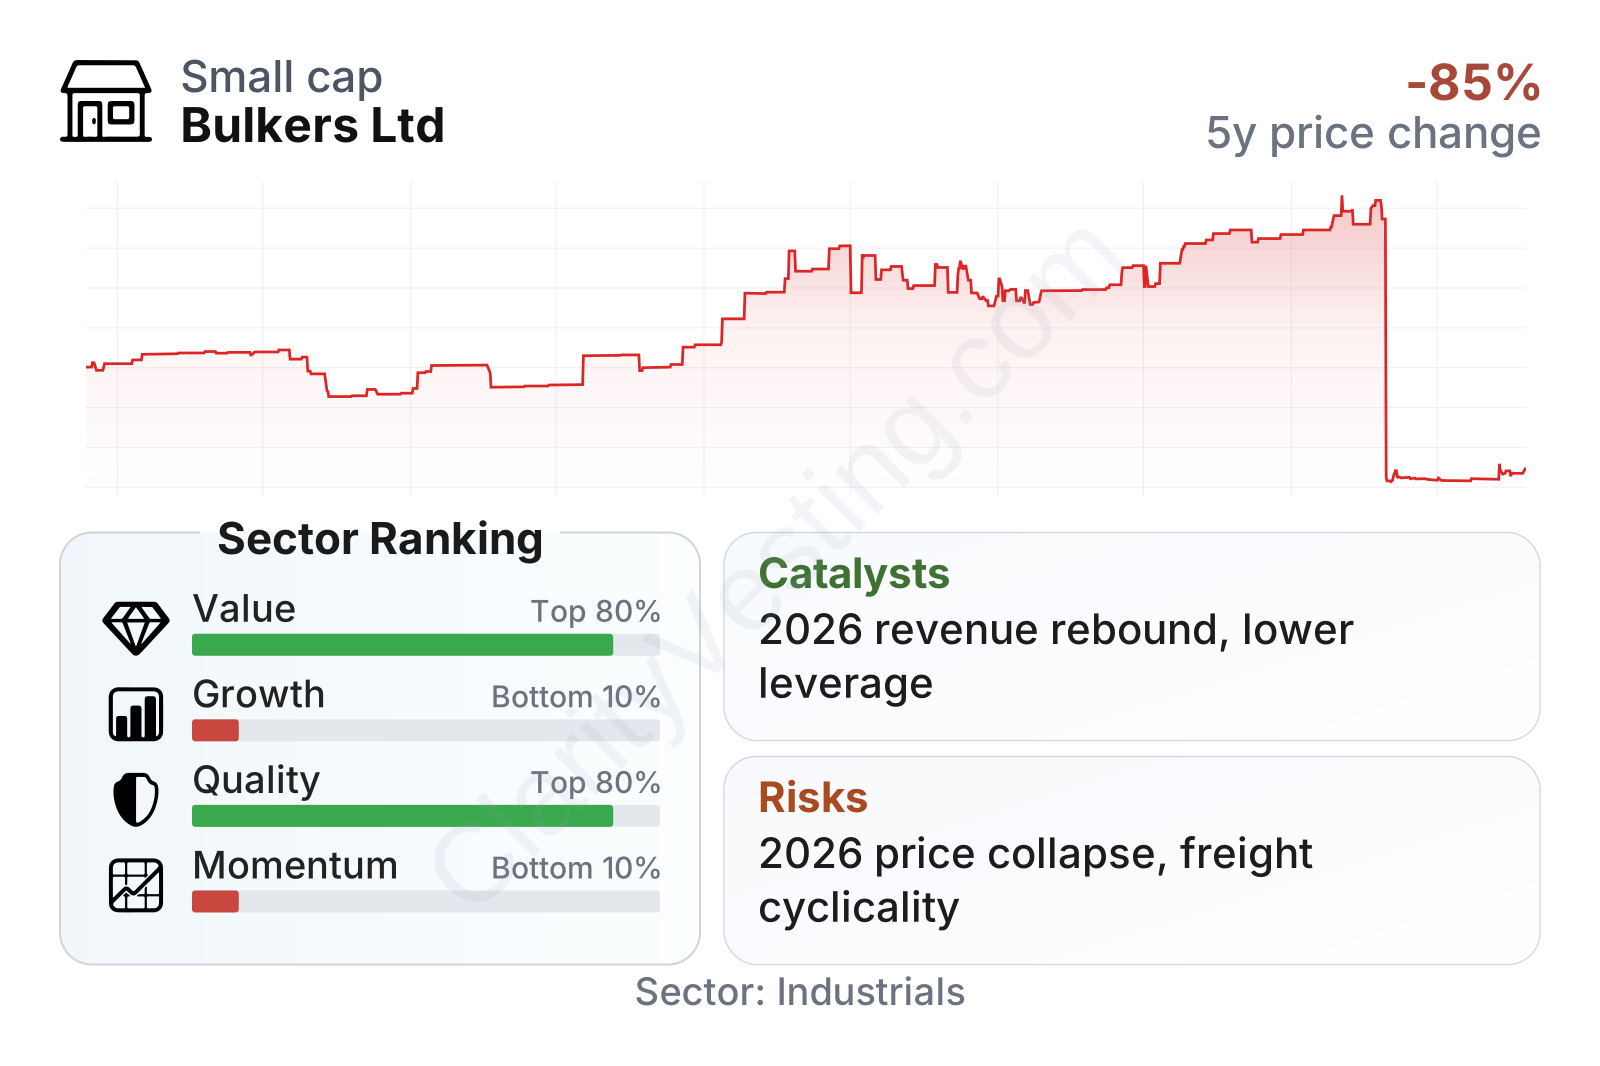
Bulkers Ltd is a small-cap shipping company with a market value a little above $1 billion, which is meaningful size for a niche operator but still modest compared with the largest global shipping groups. The stock’s recent trading pattern has been exceptionally volatile, including a collapse from above $13 earlier in 2026 to below $1 within months. That kind of move is far more extreme than normal sector swings and immediately raises questions about a corporate event, capital structure change, or market dislocation rather than routine earnings noise.
The latest factor snapshot is unusually mixed. Profitability and balance-sheet-related quality metrics look very strong relative to the broader industrial universe, with very high returns on assets and invested capital, strong interest coverage, and net debt metrics that currently appear conservative. By contrast, longer-term growth and price momentum rank near the bottom of the sector, which fits a company whose recent accounting results are strong but whose stock performance and multi-year revenue trend have been weak.
Growth
Dry bulk shipping is not a classic secular growth industry in the way software or semiconductors can be. It is more a global trade infrastructure business tied to commodity demand, fleet capacity, and shipping rates. Long-term demand is supported by population growth, food trade, steelmaking inputs, and energy transportation, but year-to-year performance is usually cyclical rather than smooth. For Bulkers Ltd, that means future expansion depends less on opening new markets and more on deploying vessels well, controlling costs, managing charters intelligently, and navigating freight cycles.
The company’s recent numbers show a sharp rebound in year-over-year revenue after a long period of contraction, which suggests operating conditions improved materially in 2026. That rebound is important because it may indicate stronger charter rates, improved fleet utilization, or a better contract mix after a weaker stretch. Still, the longer five-year picture remains less convincing, with revenue per share and free cash flow trends still pointing lower over time.
Cash generation remains one of the more important positives. Even though free cash flow is well below the peak reached in 2021, the business is still producing positive cash flow in the tens of millions of dollars. For a shipping company, that matters because internally generated cash can support debt reduction, vessel maintenance, fleet renewal, and shareholder distributions without relying too heavily on outside capital.
A meaningful catalyst is the company’s improved financial flexibility. Debt ratios have fallen sharply from the elevated levels seen a few years ago, which gives management more room to endure freight volatility and potentially act on vessel opportunities when the cycle is favorable. Another potential catalyst is any continuation of stronger 2026 revenue momentum, especially if it proves to be rate-driven rather than a temporary accounting effect.
Recent developments in the share price, however, suggest that something more than operating performance may be influencing market perception. For long-term analysis, that disconnect between strong margins and a severely damaged stock chart is one of the central issues to monitor closely.
Risks
This article is for informational purposes only and does not constitute financial advice. Some content is AI-generated. See Disclaimer