Stock Analysis · MTR Corp Ltd (MTRJF)
Overview
MTR Corp Ltd is a Hong Kong-based rail and property company best known for operating the Mass Transit Railway network. Its business combines public transportation, station-related commercial activities, property development, property leasing and management, and railway operations outside Hong Kong. That mix is important because MTR is not just a train operator: it uses its rail network to support retail rents, advertising, station businesses, and real estate projects built around transport hubs.
The company’s revenue is spread across several activities, although the exact mix can move meaningfully from year to year because property development income is lumpy. Based on recent annual reporting, the main sources of revenue are approximately:
- Hong Kong transport operations: about 35% to 40% of revenue. This includes domestic passenger rail service, cross-boundary service, airport-related transport, and associated transport activities.
- Property development: about 20% to 30%. This mainly reflects profits and revenue recognized from residential and mixed-use projects tied to MTR’s land bank and rail expansion model.
- Station commercial and property rental/management: about 15% to 20%. This includes shopping malls, retail space in and around stations, office leasing, advertising, telecommunications services, and property management fees.
- Mainland China and international railway, property rental, and consultancy: about 15% to 20%. This covers rail operations and related businesses in mainland China, the United Kingdom, Australia, and other overseas activities.
This structure gives MTR a different economic profile from a typical railroad. Ticket income is recurring and tied to urban mobility, while property and commercial activities can lift profitability when the real estate cycle is favorable. Over the last several years, total revenue has generally trended upward, recovering strongly after the pandemic period, while net income has remained supported by the broader rail-plus-property model.
The business flow shows a company with large operating scale, relatively contained overhead compared with revenue, and a profit profile that can swing with property-related recognition and financing costs. One notable feature is that earnings have held up better than pure transit revenue alone would suggest, which reflects the value of the property platform.
Key Figures
| Metric | Value | Sector ⓘ |
|---|---|---|
| Date | Oct 22, 2026 | |
| Context | ||
| Sector | Industrials | |
| Industry | Railroads | |
| Market Cap ⓘ | $27.72B | |
| Beta ⓘ | 0.62 | |
Value (Cheapness) | ||
| P/E Ratio ⓘ | 9.49 | 22.29 |
| P/B Ratio ⓘ | 0.14 | 1.98 |
| FCF Yield ⓘ | -42.45% | 6.26% |
| Dividend Yield ⓘ | 29.37% | 1.92% |
| EBIT / EV ⓘ | N/A | 4.83% |
| PEG ⓘ | 0.89 | |
Growth (Business expansion) | ||
| Revenue Growth ⓘ | -4.10% | 9.30% |
| RPS Growth (5Y CAGR) ⓘ | 3.95% | 7.76% |
| EPS Growth (5Y CAGR) ⓘ | 31.94% | -13.17% |
| BVPS Growth (5Y CAGR) ⓘ | 1.44% | 6.13% |
| Margin Growth (5Y Trend) ⓘ | -13.85% | 0.74% |
| FCF Growth (5Y CAGR) ⓘ | N/A | 10.79% |
| DPS Growth (5Y CAGR) ⓘ | 3.13% | 9.41% |
Quality (Business durability) | ||
| ROIC (Latest) ⓘ | N/A | 10.75% |
| ROA (Latest) ⓘ | 9.36% | 5.41% |
| ROIC (5Y Median) ⓘ | 4.79% | 9.37% |
| ROA (5Y Median) ⓘ | 3.28% | 4.95% |
| Net Debt / EBIT (Latest) ⓘ | 3.10 | 2.04 |
| Net Debt / EBIT (5Y Median) ⓘ | 2.22 | 2.27 |
| Net Debt / EBITDA (Latest) ⓘ | 2.51 | 1.39 |
| Net Debt / Assets ⓘ | 18.24% | 19.27% |
| EBITDA / Interest ⓘ | 9.16 | 9.58 |
| Operating Margin (Latest) ⓘ | 25.73% | 10.49% |
| Operating Margin (5Y Median) ⓘ | 28.24% | 10.30% |
| Debt to Equity (Latest) ⓘ | 99.78% | 64.82% |
| Profit Margin (Latest) ⓘ | 44.30% | 6.67% |
| Free Cash Flow (Latest) ⓘ | -$11.77B | |
Momentum (Price trend) | ||
| 3Y Return ⓘ | +28.10% | +67.77% |
| 12M Return (excl. last month) ⓘ | +34.48% | +12.05% |
| 6M Return ⓘ | +25.31% | 0.00% |
| Price vs. 200-Day MA ⓘ | +22.73% | +0.67% |
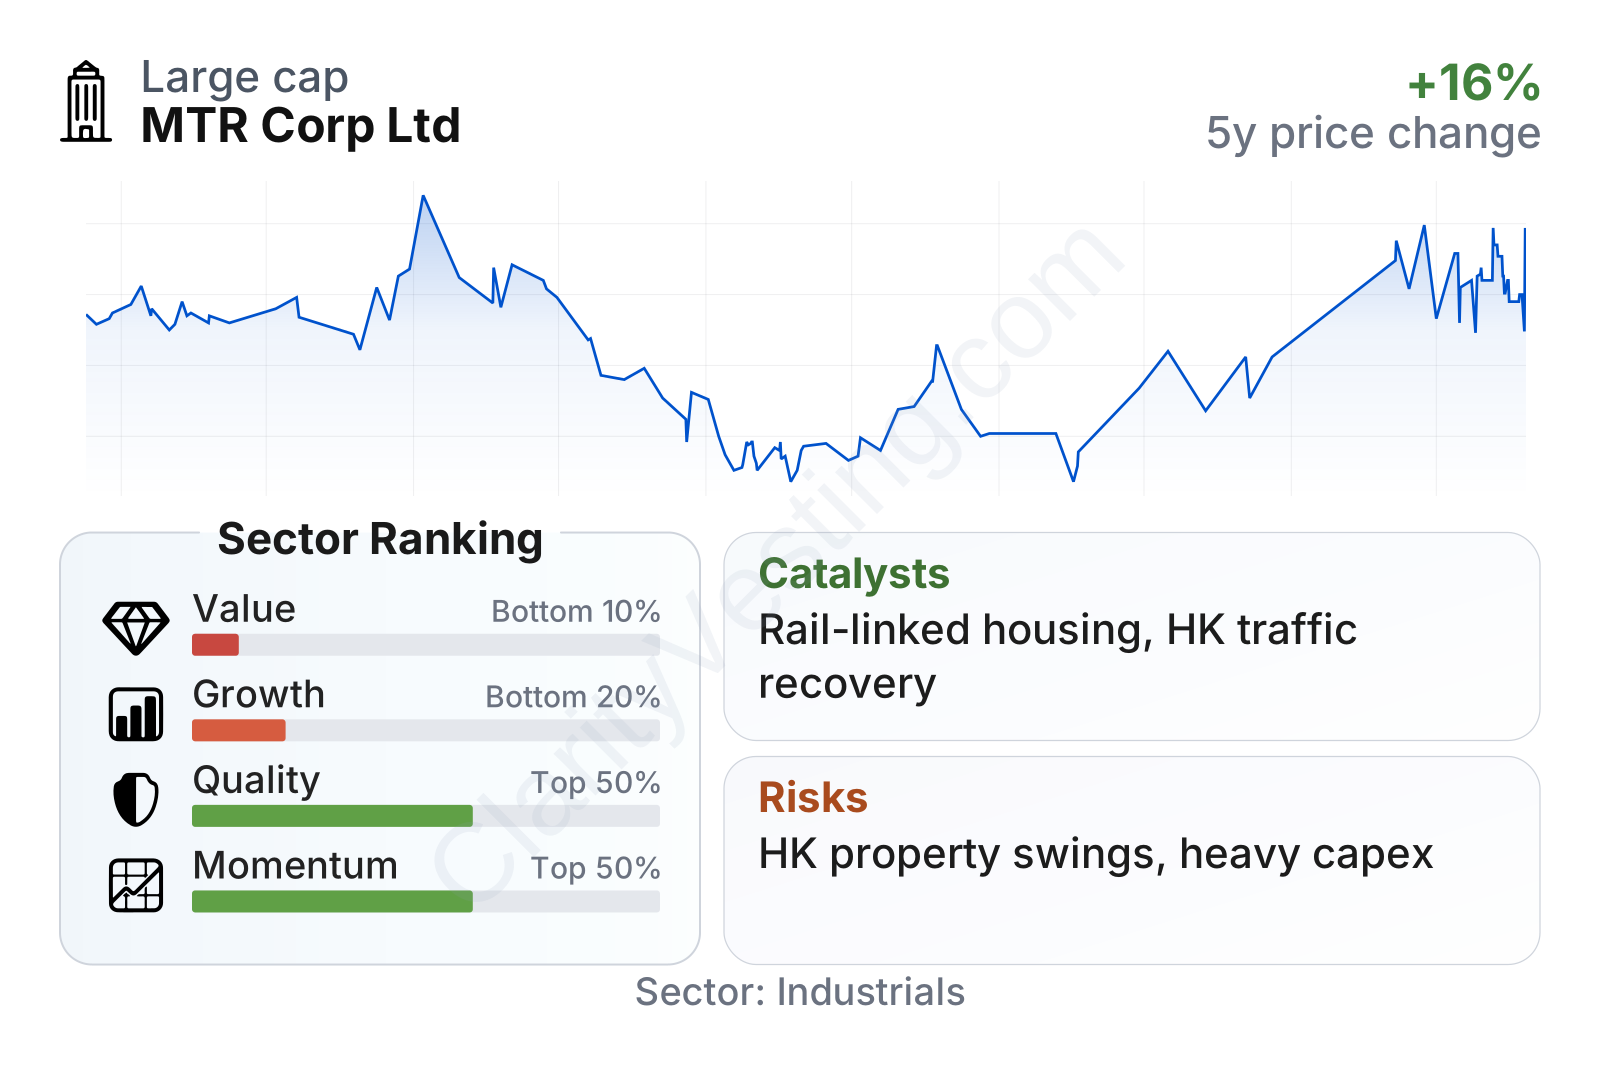
MTR stands out as a large, lower-volatility infrastructure operator. Recent market performance has been firm over the last 6 to 12 months, but the longer three-year share price gain has been more modest. The metrics table points to a mixed profile: valuation ratios look very low versus the broader industrial sector, profitability is strong, but growth ranks weakly and free cash flow is currently negative. That combination usually signals a business with durable assets and accounting profits, but also heavy capital spending and uneven revenue timing.
Quality indicators are better than the sector median in several areas, especially operating margin and profit margin. Debt is meaningful but not extreme for an infrastructure-heavy business, and interest coverage remains solid. The weak point is growth: recent revenue has been softer than the sector median, and long-term expansion in book value and dividends has been relatively slow.
Growth
MTR operates in a sector with long-term structural relevance. Dense cities still need high-capacity public transit, and governments across Asia and other developed markets continue to support rail as a way to reduce congestion and emissions. That does not make the sector fast-growing in the way software or semiconductors can be, but it does support steady demand over long periods.
MTR’s strategy is distinctive and generally logical for long-duration growth because it links rail investment to property development and recurring rental income. In simple terms, the company helps create transport corridors, then captures part of the economic value created around stations through housing, malls, offices, and retail space. This approach has historically allowed MTR to earn better margins than many transit operators that depend almost entirely on fares.
Future growth is likely to come from three main areas. First, ongoing recovery and normalization in passenger volumes can support transport revenue and station retail activity. Second, new property project completions can create periodic jumps in earnings. Third, overseas rail concessions and service contracts can add scale, although these businesses usually offer lower margins than Hong Kong property-linked operations.
A meaningful catalyst is Hong Kong’s longer-term housing and infrastructure pipeline, especially projects tied to railway expansion and land development. MTR remains deeply embedded in the city’s transport system and urban planning framework, which gives it access to opportunities that are difficult for rivals to replicate. Another supportive factor is its commercial property exposure in prime transit-linked locations, where occupancy and rental resilience can benefit from improving foot traffic.
Recent company communications and annual disclosures also continue to emphasize investment in new rail projects, asset enhancement, digital operations, and transit-oriented development. None of these are sudden breakthroughs, but together they reinforce a model built for durability rather than rapid short-term expansion.
Risks
This article is for informational purposes only and does not constitute financial advice. Some content is AI-generated. See Disclaimer


