Stock Analysis · Parex Resources Inc (PARXF)
Overview
Parex Resources Inc. is a Canadian oil and gas exploration and production company focused mainly on Colombia. Its business is straightforward: it acquires exploration acreage, drills wells, produces crude oil and natural gas, and sells those volumes into local and export markets. The company has built its identity around operating conventional onshore fields with relatively low costs and a disciplined balance sheet.
Revenue is overwhelmingly tied to hydrocarbons production, with crude oil clearly dominating the mix. Based on the company’s recent annual reporting and operating disclosures, the revenue profile can be summarized as follows:
- Crude oil sales: approximately 90% to 95% of revenue. This is the core business and includes production from the company’s Colombian blocks, where realized prices are influenced by Brent-linked benchmarks, quality differentials, transportation, and local commercial terms.
- Natural gas sales: approximately 3% to 7% of revenue. Gas is a much smaller contributor than oil but still provides some diversification within the production base.
- Royalties, midstream-related, and other operating revenue: approximately 0% to 5%. This can include smaller commercial items tied to field operations and contractual arrangements, but it is not the main earnings driver.
Geographically, the business is highly concentrated. Colombia accounts for effectively all operating activity and the vast majority of economic exposure. That concentration simplifies the business model, but it also means country-specific regulation, taxation, security conditions, and transportation infrastructure matter more here than for globally diversified producers.
The company’s cost structure has also been a notable feature. Over the last several years, Parex has generally converted a large share of revenue into operating income, helped by low operating costs and limited corporate overhead. At the same time, earnings have been volatile because oil prices, taxes, and one-off items can swing results sharply from year to year.
The broad pattern is clear: revenue rose strongly during the 2022 commodity upswing, then moderated as prices and volumes normalized. Even with that pullback, the company has continued to show a business that can still retain meaningful operating profit from each dollar of sales when market conditions are supportive.
Key Figures
| Metric | Value | Sector ⓘ |
|---|---|---|
| Date | Oct 22, 2026 | |
| Context | ||
| Sector | Energy | |
| Industry | Oil & Gas E&P | |
| Market Cap ⓘ | $2.01B | |
| Beta ⓘ | 0.65 | |
Value (Cheapness) | ||
| P/E Ratio ⓘ | 3.50 | 15.40 |
| P/B Ratio ⓘ | 0.86 | 1.71 |
| FCF Yield ⓘ | 9.49% | 8.24% |
| Dividend Yield ⓘ | 5.29% | 3.52% |
| EBIT / EV ⓘ | 12.56% | 7.45% |
| PEG ⓘ | N/A | |
Growth (Business expansion) | ||
| Revenue Growth ⓘ | 86.70% | 26.85% |
| RPS Growth (5Y CAGR) ⓘ | 2.30% | 6.78% |
| EPS Growth (5Y CAGR) ⓘ | 9.49% | -14.41% |
| BVPS Growth (5Y CAGR) ⓘ | 15.94% | 6.08% |
| Margin Growth (5Y Trend) ⓘ | -20.34% | 0.55% |
| FCF Growth (5Y CAGR) ⓘ | -8.27% | 2.75% |
| DPS Growth (5Y CAGR) ⓘ | 31.29% | 16.79% |
Quality (Business durability) | ||
| ROIC (Latest) ⓘ | N/A | 11.30% |
| ROA (Latest) ⓘ | 17.37% | 6.00% |
| ROIC (5Y Median) ⓘ | 22.17% | 10.35% |
| ROA (5Y Median) ⓘ | 18.23% | 5.46% |
| Net Debt / EBIT (Latest) ⓘ | 2.11 | 1.64 |
| Net Debt / EBIT (5Y Median) ⓘ | -0.09 | 1.82 |
| Net Debt / EBITDA (Latest) ⓘ | 1.22 | 1.08 |
| Net Debt / Assets ⓘ | 15.25% | 17.29% |
| EBITDA / Interest ⓘ | 24.56 | 9.53 |
| Operating Margin (Latest) ⓘ | 28.73% | 16.21% |
| Operating Margin (5Y Median) ⓘ | 33.27% | 20.55% |
| Debt to Equity (Latest) ⓘ | 34.66% | 52.27% |
| Profit Margin (Latest) ⓘ | 54.96% | 8.79% |
| Free Cash Flow (Latest) ⓘ | $190.41M | |
Momentum (Price trend) | ||
| 3Y Return ⓘ | +44.59% | +68.93% |
| 12M Return (excl. last month) ⓘ | +50.96% | +42.90% |
| 6M Return ⓘ | +11.07% | +9.18% |
| Price vs. 200-Day MA ⓘ | +18.62% | +9.87% |
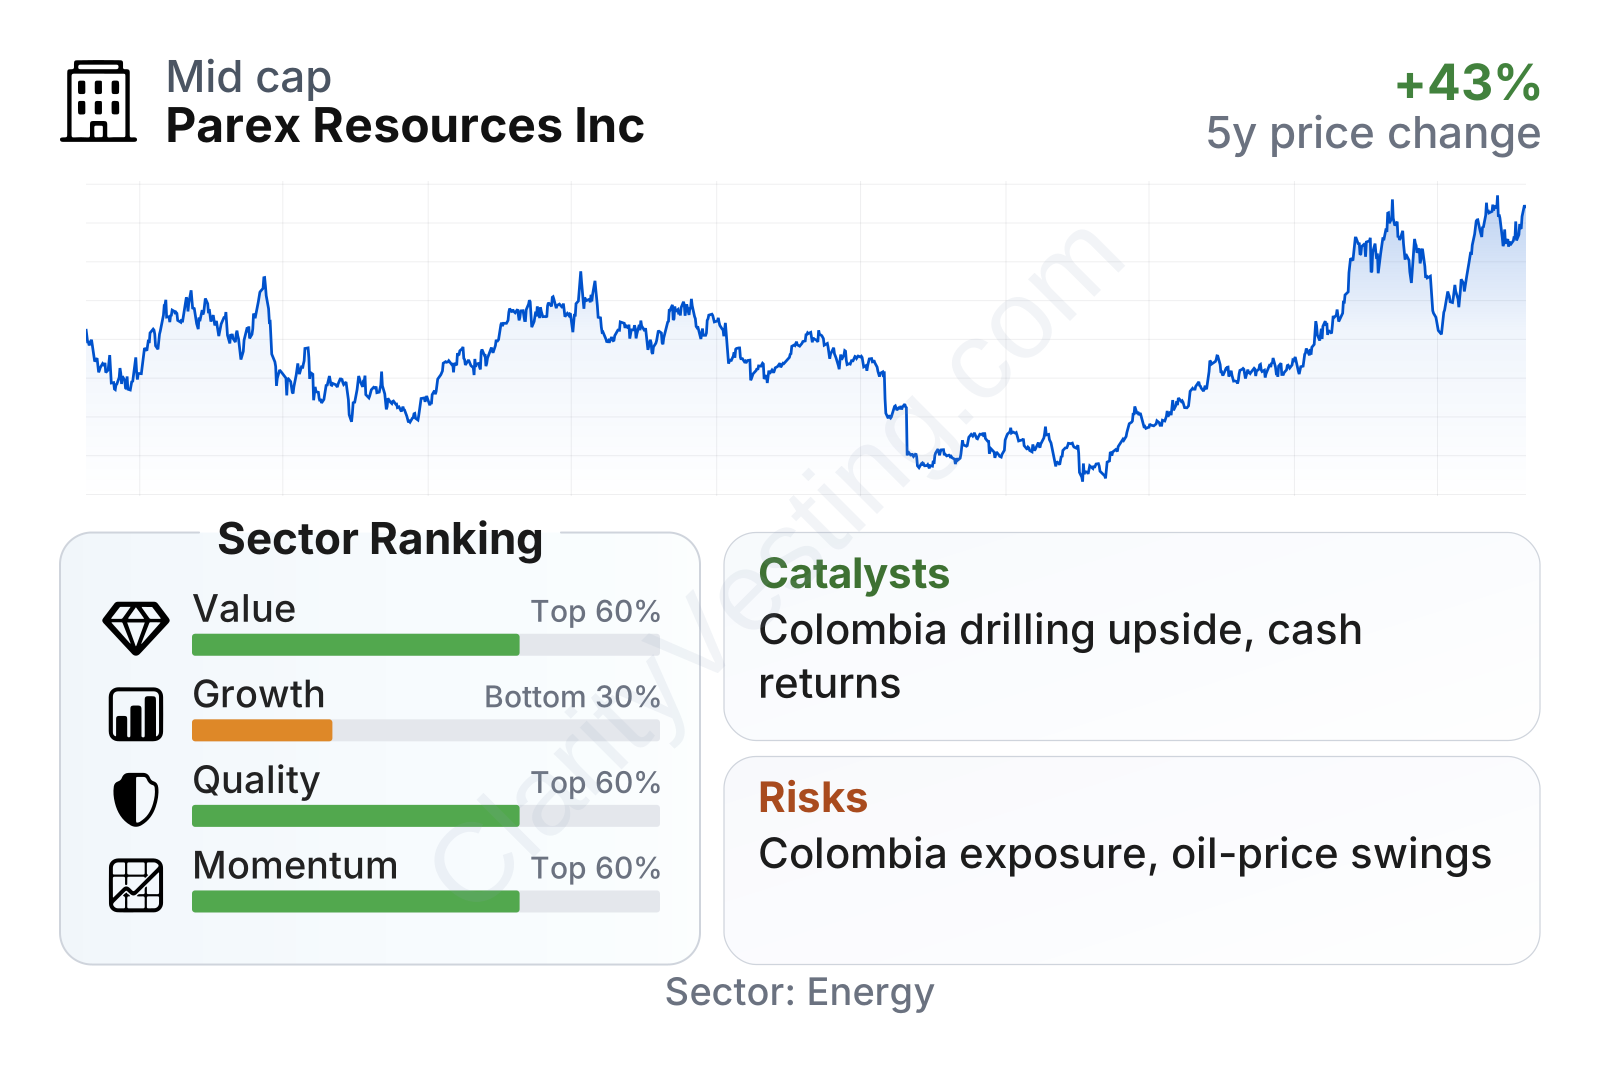
Parex sits in the mid-cap range and has shown a relatively low beta for an oil producer, which is somewhat unusual in a commodity business. The table also points to a mixed but understandable profile: valuation metrics look inexpensive versus much of the energy sector, quality measures remain solid, and momentum has improved, while longer-term growth readings are less impressive because the business has gone through a down-cycle in revenue and free cash flow after peak oil-price conditions.
Profitability and capital efficiency stand out. Operating margin and returns on assets are comfortably above sector medians, while leverage is still moderate and interest coverage is strong. The weaker area is not financial strength but durability of expansion: recent recovery has been sharp, yet the five-year record shows that growth has been uneven rather than consistently compounding.
Growth
Parex operates in a sector that is mature rather than structurally high-growth. Oil and gas exploration and production does not benefit from the same secular demand narrative as software or semiconductors. However, long-term global energy demand still supports the need for conventional supply, especially low-cost barrels that can remain profitable through price cycles. In that context, Parex’s strategy makes sense: concentrate on assets where development costs are manageable, preserve balance-sheet flexibility, and selectively invest in exploration and production growth when returns appear attractive.
A key point for long-term analysis is that growth here depends less on selling into a rapidly expanding market and more on replacing reserves, increasing production efficiently, and allocating capital better than peers. That is why operational execution matters more than headline industry growth. Parex has historically emphasized high-return drilling, disciplined acquisitions, and shareholder distributions while avoiding excessive leverage.
Revenue growth has been highly cyclical. The company experienced a strong upswing during the commodity boom, then a prolonged period of contraction, and more recently a sharp rebound. That pattern says two things at once: first, Parex is clearly exposed to oil-price and production swings; second, when conditions improve, the business can recover quickly because its operating base is relatively efficient.
Free cash flow has followed the same uneven path. It was very strong during favorable pricing periods, dropped dramatically during a weaker stretch, and then recovered. For a long-term reader, that is important because cash generation funds dividends, exploration spending, and any acquisitions. The current level still indicates healthy cash production for a company of this size, even if it is below prior peak-cycle numbers.
As for catalysts, the main ones are operational and country-specific rather than transformational technology. Reserve replacement, exploration success on existing blocks, and stable or improving Colombian operating conditions could all support future performance. Company updates in 2026 also suggest continued focus on disciplined capital returns and field development, while stronger recent profitability and stock performance indicate that the market has started to recognize the rebound in fundamentals.
Risks
This article is for informational purposes only and does not constitute financial advice. Some content is AI-generated. See Disclaimer