Stock Analysis · Atmos Energy Corporation (ATO)
Overview
Atmos Energy is a regulated natural gas utility in the United States. Its core business is delivering natural gas to homes, businesses, and public-authority customers through local distribution systems. The company also owns a large regulated pipeline and storage business that moves gas across Texas and serves utilities, power generators, and industrial users. In simple terms, Atmos earns most of its money from infrastructure that is considered essential: local gas networks and transportation pipelines.
The business is concentrated in regulated operations, which matters because rates, investment recovery, and allowed returns are set through state and federal regulatory frameworks rather than by fully open market pricing. That usually makes revenue more stable than in many other industries, although growth tends to be gradual and tied to customer additions and infrastructure spending.
Based on the company’s recent annual reporting structure, revenue is mainly generated from the following sources:
- Natural gas distribution: approximately 70% to 75% of total revenue. This includes gas sold and delivered to residential, commercial, and industrial customers across multiple states, plus related rider mechanisms and regulated charges.
- Pipeline and storage: approximately 25% to 30% of total revenue. This business transports and stores natural gas, largely in Texas, under regulated arrangements and long-term customer relationships.
That revenue mix understates the importance of the pipeline segment to long-term value creation, because pipeline and safety-reliability investments expand the regulated asset base that supports future earnings. Over the last several years, total revenue has moved unevenly because gas costs can pass through customer bills, but operating income and net income have shown a steadier upward direction, which is usually more important for a regulated utility than headline sales alone.
The profit flow shows a useful pattern: revenue has fluctuated with commodity-related bill movements, but operating income and net income have climbed consistently over time. That suggests Atmos has been converting infrastructure investment and rate recovery into stronger earnings, even when top-line growth looked less linear.
Key Figures
| Metric | Value | Sector ⓘ |
|---|---|---|
| Date | Oct 17, 2026 | |
| Context | ||
| Sector | Utilities | |
| Industry | Utilities - Regulated Gas | |
| Market Cap ⓘ | $27.62B | |
| Beta ⓘ | 0.57 | |
Value (Cheapness) | ||
| P/E Ratio ⓘ | 19.48 | 17.28 |
| P/B Ratio ⓘ | 1.82 | 1.51 |
| FCF Yield ⓘ | -7.31% | 0.65% |
| Dividend Yield ⓘ | 2.38% | 3.77% |
| EBIT / EV ⓘ | 5.22% | 5.01% |
| PEG ⓘ | 1.90 | |
Growth (Business expansion) | ||
| Revenue Growth ⓘ | 4.80% | 6.10% |
| RPS Growth (5Y CAGR) ⓘ | 2.78% | 3.87% |
| EPS Growth (5Y CAGR) ⓘ | 6.71% | -11.30% |
| BVPS Growth (5Y CAGR) ⓘ | 8.51% | 4.23% |
| Margin Growth (5Y Trend) ⓘ | 8.58% | 3.57% |
| FCF Growth (5Y CAGR) ⓘ | -16.12% | -8.84% |
| DPS Growth (5Y CAGR) ⓘ | 8.43% | 4.84% |
Quality (Business durability) | ||
| ROIC (Latest) ⓘ | 6.26% | 6.53% |
| ROA (Latest) ⓘ | 4.64% | 3.20% |
| ROIC (5Y Median) ⓘ | 8.94% | 5.95% |
| ROA (5Y Median) ⓘ | 3.96% | 2.75% |
| Net Debt / EBIT (Latest) ⓘ | 5.15 | 7.13 |
| Net Debt / EBIT (5Y Median) ⓘ | 6.25 | 7.23 |
| Net Debt / EBITDA (Latest) ⓘ | 3.65 | 4.31 |
| Net Debt / Assets ⓘ | 30.82% | 38.42% |
| EBITDA / Interest ⓘ | 19.69 | 4.58 |
| Operating Margin (Latest) ⓘ | 38.38% | 20.83% |
| Operating Margin (5Y Median) ⓘ | 26.59% | 20.08% |
| Debt to Equity (Latest) ⓘ | 67.24% | 137.69% |
| Profit Margin (Latest) ⓘ | 28.50% | 11.37% |
| Free Cash Flow (Latest) ⓘ | -$2.02B | |
Momentum (Price trend) | ||
| 3Y Return ⓘ | +57.46% | +52.37% |
| 12M Return (excl. last month) ⓘ | +0.66% | +8.84% |
| 6M Return ⓘ | -11.85% | -3.95% |
| Price vs. 200-Day MA ⓘ | -5.05% | -0.79% |
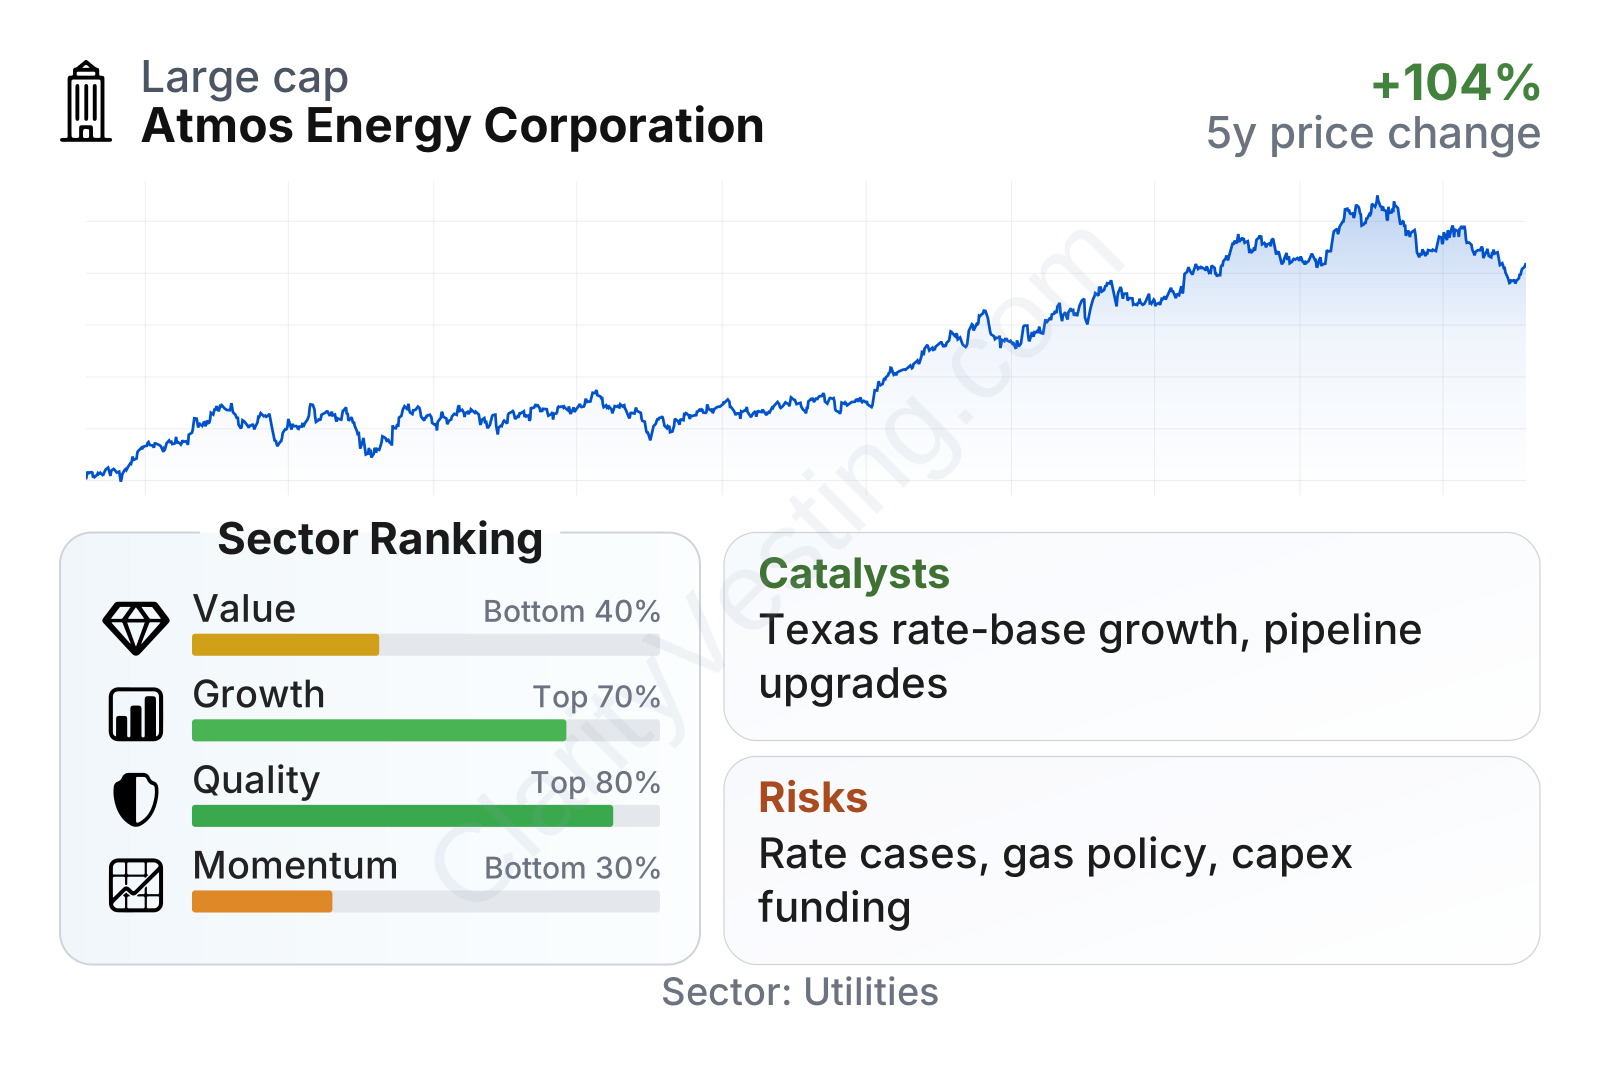
Atmos stands out more for balance-sheet discipline and operating quality than for bargain valuation or fast sales growth. It ranks well within its sector on profitability, returns over time, and interest coverage, while recent share-price momentum has been weaker and valuation measures sit somewhat above the sector median. The company is also relatively low-volatility, as reflected in its beta below 1, which fits the profile of a large regulated utility.
The stock’s longer-term price trend has been clearly positive, although the most recent period shows some pullback from earlier highs. That mix often reflects a business that the market has rewarded for dependable earnings and dividends, but where enthusiasm has cooled as valuation became fuller and interest-rate conditions stayed important for utilities.
Growth
Atmos operates in a mature sector, not a high-growth one. Regulated gas utilities generally do not expand through sudden demand surges; instead, they grow through customer additions, system modernization, pipeline expansion, and approved rate-base investment. For long-term analysis, that can still be attractive when a company has a large backlog of infrastructure needs and a constructive regulatory environment.
Atmos appears well positioned on that front. Its strategy centers on replacing aging pipes, improving safety and reliability, and investing in transmission and storage assets in high-demand regions, especially Texas. This is a sensible approach because those projects typically become part of the regulated asset base, which can support future earnings growth if regulators allow recovery. Population growth in Texas and other Sun Belt markets is an added tailwind, since more households and businesses can translate into more customer connections and more network usage over time.
Revenue per share has not followed a straight upward line, which is normal for a gas utility because customer bills can swing with gas costs and weather. What matters more is that the broader trend has remained stable to moderately positive, while earnings per share growth over five years has been stronger than much of the sector.
Free cash flow has been volatile and recently deeply negative, but that should be read carefully in the case of a utility. Heavy capital spending can push free cash flow below zero for extended periods while the company is building assets that later earn regulated returns. In Atmos’s case, this looks more like an infrastructure-investment pattern than a sign of a collapsing core business. Still, it raises the importance of financing conditions and regulatory execution.
A notable catalyst is the company’s multiyear capital program tied to safety, modernization, and pipeline investment. Another is continued demographic growth in its service territories, particularly Texas. In recent company communications, Atmos has also continued to emphasize rate filings and regulatory mechanisms designed to recover investment more efficiently, which supports visibility into future earnings growth.
Risks
This article is for informational purposes only and does not constitute financial advice. Some content is AI-generated. See Disclaimer


