Stock Analysis · Edison International (EIX)
Overview
Edison International is a U.S. electric utility holding company. Its business is centered on Southern California Edison, the regulated electric utility that delivers power to a large service area across Southern California. In simple terms, the group makes money by operating electricity transmission and distribution networks, maintaining the grid, connecting customers, and recovering approved costs plus an allowed return through rates set by California regulators. Edison International also has a smaller non-utility energy services activity, but the company is overwhelmingly a regulated utility.
Because of that structure, revenue is much more concentrated than in a diversified industrial or technology company. Based on recent annual reporting, the main sources of revenue are approximately:
- Electric utility operations: about 95% to 98% of total revenue. This includes retail electricity sales, transmission and distribution services, and various balancing and regulatory mechanisms tied to serving customers in Southern California.
- Non-utility and other activities: about 2% to 5% of total revenue. This mainly includes Edison Energy-type advisory and related energy services activities, plus holding-company level and other smaller items.
The business model is important for long-term analysis: Edison International is not primarily driven by launching new products or taking market share nationwide. Its economics depend more on customer demand, capital investment into the grid, regulatory approvals, wildfire mitigation, and the company’s ability to earn an authorized return on a very large asset base.
Over the last several years, total revenue has generally moved upward, while operating income has improved faster than sales. Net income rose sharply in 2025, although that jump appears unusually strong compared with prior years and should be read with care rather than treated as a normal run rate. Interest expense remains substantial, which is typical for utilities but still relevant when rates stay elevated.
The business has become more profitable at the operating level over time, with revenue and gross profit trending higher overall. At the same time, financing costs remain heavy, which shows how much utility economics depend on access to debt markets and supportive regulation.
Key Figures
| Metric | Value | Sector ⓘ |
|---|---|---|
| Date | Oct 17, 2026 | |
| Context | ||
| Sector | Utilities | |
| Industry | Utilities - Regulated Electric | |
| Market Cap ⓘ | $21.35B | |
| Beta ⓘ | 0.61 | |
Value (Cheapness) | ||
| P/E Ratio ⓘ | 5.72 | 17.28 |
| P/B Ratio ⓘ | 1.34 | 1.51 |
| FCF Yield ⓘ | -1.82% | 0.65% |
| Dividend Yield ⓘ | 6.22% | 3.77% |
| EBIT / EV ⓘ | 7.03% | 5.01% |
| PEG ⓘ | 2.38 | |
Growth (Business expansion) | ||
| Revenue Growth ⓘ | -4.10% | 6.10% |
| RPS Growth (5Y CAGR) ⓘ | 6.35% | 3.87% |
| EPS Growth (5Y CAGR) ⓘ | -11.30% | -11.30% |
| BVPS Growth (5Y CAGR) ⓘ | 6.91% | 4.23% |
| Margin Growth (5Y Trend) ⓘ | 16.83% | 3.57% |
| FCF Growth (5Y CAGR) ⓘ | -39.94% | -8.84% |
| DPS Growth (5Y CAGR) ⓘ | 7.38% | 4.84% |
Quality (Business durability) | ||
| ROIC (Latest) ⓘ | 6.46% | 6.53% |
| ROA (Latest) ⓘ | 4.11% | 3.20% |
| ROIC (5Y Median) ⓘ | 6.23% | 5.95% |
| ROA (5Y Median) ⓘ | 1.76% | 2.75% |
| Net Debt / EBIT (Latest) ⓘ | 9.63 | 7.13 |
| Net Debt / EBIT (5Y Median) ⓘ | 11.18 | 7.23 |
| Net Debt / EBITDA (Latest) ⓘ | 5.53 | 4.31 |
| Net Debt / Assets ⓘ | 45.02% | 38.42% |
| EBITDA / Interest ⓘ | 4.42 | 4.58 |
| Operating Margin (Latest) ⓘ | 23.14% | 20.83% |
| Operating Margin (5Y Median) ⓘ | 19.14% | 20.08% |
| Debt to Equity (Latest) ⓘ | 248.39% | 137.69% |
| Profit Margin (Latest) ⓘ | 19.28% | 11.37% |
| Free Cash Flow (Latest) ⓘ | -$389.00M | |
Momentum (Price trend) | ||
| 3Y Return ⓘ | -1.55% | +52.37% |
| 12M Return (excl. last month) ⓘ | +5.38% | +8.84% |
| 6M Return ⓘ | -21.21% | -3.95% |
| Price vs. 200-Day MA ⓘ | -16.14% | -0.79% |
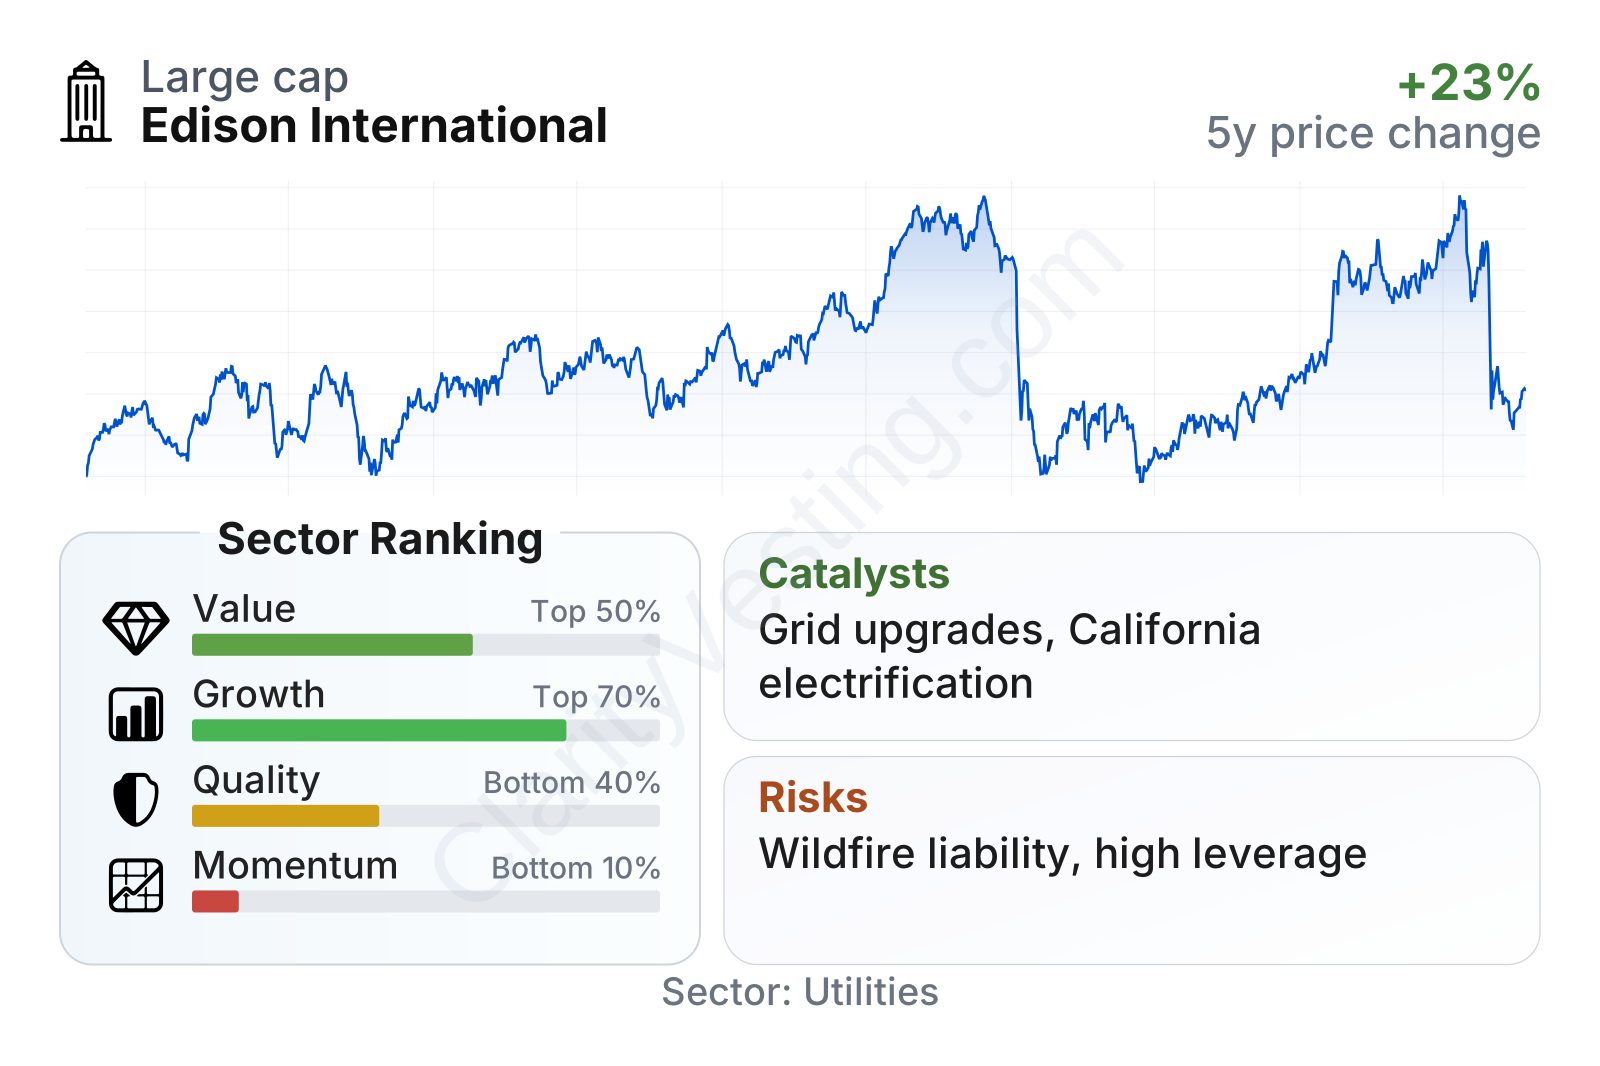
Edison International is a large-cap utility with lower share-price volatility than the broader market, reflected in a beta well below 1. On valuation multiples, it screens cheaply versus the utility sector, with a P/E and price-to-book ratio below sector medians and a dividend yield above the sector median. Growth metrics are mixed: longer-term revenue per share and book value per share trends look solid, but recent year-over-year revenue softened and free cash flow remains negative. Quality is more uneven, as margins are healthy but leverage is clearly above the sector norm.
Growth
The company operates in a sector with durable long-term demand. Electric utilities are tied to some of the biggest infrastructure trends in the U.S. economy: grid modernization, electrification of transportation and buildings, renewable integration, transmission expansion, and resilience spending. California in particular requires major grid investment to support clean energy targets, wildfire hardening, and rising electricity needs from electric vehicles and data-heavy economic activity.
That backdrop fits Edison International’s strategy. For a regulated utility, growth usually comes from expanding the rate base rather than rapidly increasing unit sales. In practice, that means investing billions of dollars into poles, wires, substations, transmission lines, and wildfire mitigation equipment, then seeking regulatory approval to earn a return on those investments over time. This is a sensible path for a utility with an established franchise in a dense and economically important region.
Revenue per share has moved higher over the past five years, which suggests that the company has been able to expand its business faster than its share count. That is a constructive sign for a utility, where steady compounding is usually more important than rapid swings in top-line growth.
Free cash flow is a more complicated part of the picture. It has remained negative, although the deficit is much smaller than it was a few years ago. For utilities, negative free cash flow is not automatically a red flag because large capital programs are common and often support future regulated earnings. Still, it means growth depends on continued financing capacity and constructive regulatory outcomes.
Recent company communications and filings have continued to emphasize grid investment, wildfire mitigation, and system reliability. Those are meaningful catalysts because they can support a larger regulated asset base over time. Another positive driver is the broader push to electrify transportation and industry in California, which can require more network upgrades even if customer usage growth remains uneven. In addition, if the stronger earnings profile seen recently proves durable rather than one-off, the gap between the company’s earnings multiple and the sector could remain a major point of attention.
Risks
This article is for informational purposes only and does not constitute financial advice. Some content is AI-generated. See Disclaimer


