Stock Analysis · MGE Energy Inc (MGEE)
Overview
MGE Energy is a regulated utility holding company based in Wisconsin. Its core business is supplying electricity and natural gas through Madison Gas and Electric, which serves customers in and around Madison. The company also owns generation assets, including renewable energy investments, and its business model is built around earning regulated returns on infrastructure such as power plants, transmission links, distribution systems, and grid upgrades.
For long-term analysis, the most important point is that MGE Energy operates in a defensive part of the market. Regulated utilities usually do not grow quickly, but they often benefit from predictable customer demand, relatively visible earnings, and a framework where state regulators allow recovery of many investment costs over time.
The company’s revenue mix is concentrated in its utility activities. Based on recent annual filings, the main sources of revenue are approximately:
- Electric utility revenue: about 75% to 80% — retail electricity sales to residential, commercial, and industrial customers, plus certain wholesale and transmission-related activity.
- Gas utility revenue: about 20% to 25% — natural gas sales and delivery service, with demand influenced by weather and customer usage.
- Other revenue: below 5% — smaller non-utility and energy-related items, including renewable project-related activity and miscellaneous services.
This concentration makes MGE Energy relatively easy to understand: its fortunes depend mainly on customer demand in its service territory, the pace of capital investment, and the regulatory treatment of those investments. Over the last several years, profitability has generally improved even when total revenue has not moved in a straight line, which is typical for utilities where fuel costs and rate structures can distort top-line comparisons.
The financial flow also shows a useful pattern: revenue has been fairly stable overall, while net income has edged upward and margins have remained solid. That suggests the business has been converting a steady customer base into gradually better earnings rather than relying on rapid sales expansion.
Key Figures
| Metric | Value | Sector ⓘ |
|---|---|---|
| Date | Oct 17, 2026 | |
| Context | ||
| Sector | Utilities | |
| Industry | Utilities - Regulated Electric | |
| Market Cap ⓘ | $2.69B | |
| Beta ⓘ | 0.69 | |
Value (Cheapness) | ||
| P/E Ratio ⓘ | 17.37 | 17.28 |
| P/B Ratio ⓘ | 1.85 | 1.51 |
| FCF Yield ⓘ | -6.11% | 0.65% |
| Dividend Yield ⓘ | 2.69% | 3.77% |
| EBIT / EV ⓘ | 4.90% | 5.01% |
| PEG ⓘ | 4.12 | |
Growth (Business expansion) | ||
| Revenue Growth ⓘ | 1.10% | 6.10% |
| RPS Growth (5Y CAGR) ⓘ | 0.97% | 3.87% |
| EPS Growth (5Y CAGR) ⓘ | -8.32% | -11.30% |
| BVPS Growth (5Y CAGR) ⓘ | 6.04% | 4.23% |
| Margin Growth (5Y Trend) ⓘ | 2.68% | 3.57% |
| FCF Growth (5Y CAGR) ⓘ | 55.43% | -8.84% |
| DPS Growth (5Y CAGR) ⓘ | 5.15% | 4.84% |
Quality (Business durability) | ||
| ROIC (Latest) ⓘ | 6.94% | 6.53% |
| ROA (Latest) ⓘ | 4.76% | 3.20% |
| ROIC (5Y Median) ⓘ | N/A | 5.95% |
| ROA (5Y Median) ⓘ | 4.41% | 2.75% |
| Net Debt / EBIT (Latest) ⓘ | 4.95 | 7.13 |
| Net Debt / EBIT (5Y Median) ⓘ | 4.37 | 7.23 |
| Net Debt / EBITDA (Latest) ⓘ | 3.01 | 4.31 |
| Net Debt / Assets ⓘ | 26.93% | 38.42% |
| EBITDA / Interest ⓘ | 8.00 | 4.58 |
| Operating Margin (Latest) ⓘ | 23.34% | 20.83% |
| Operating Margin (5Y Median) ⓘ | 25.48% | 20.08% |
| Debt to Equity (Latest) ⓘ | 62.45% | 137.69% |
| Profit Margin (Latest) ⓘ | 19.90% | 11.37% |
| Free Cash Flow (Latest) ⓘ | -$164.26M | |
Momentum (Price trend) | ||
| 3Y Return ⓘ | +6.72% | +52.37% |
| 12M Return (excl. last month) ⓘ | -7.43% | +8.84% |
| 6M Return ⓘ | -9.57% | -3.95% |
| Price vs. 200-Day MA ⓘ | -7.54% | -0.79% |
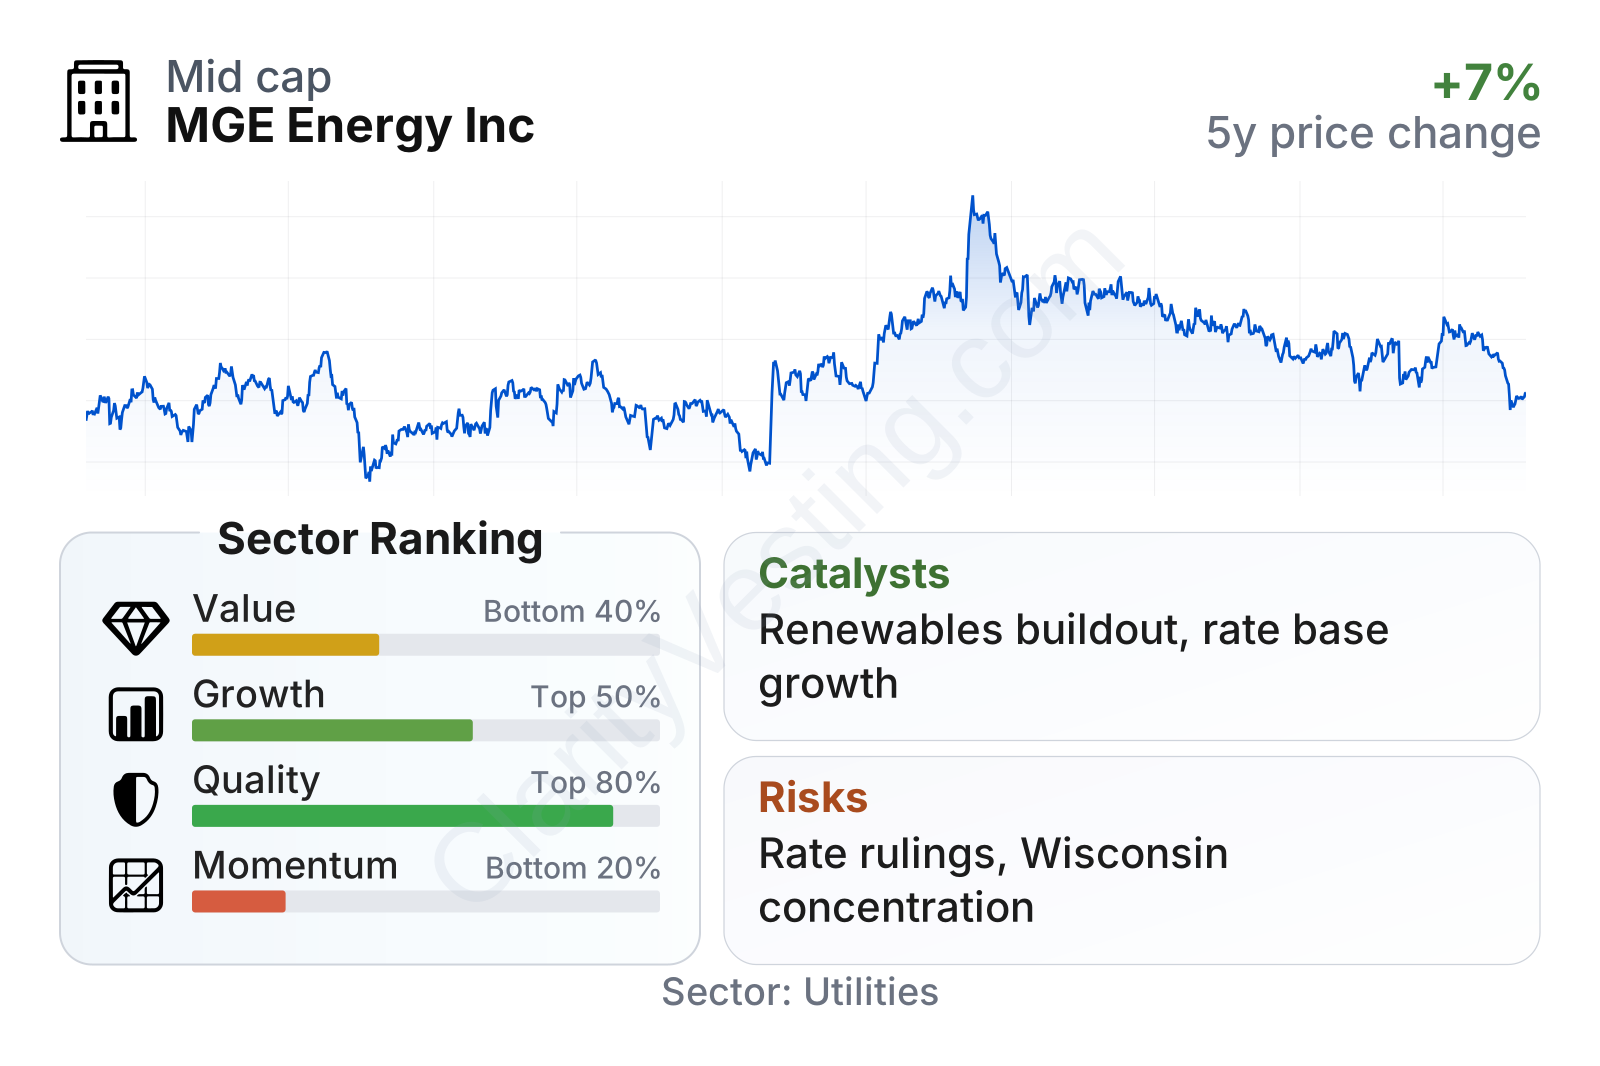
MGE Energy stands out more for balance-sheet discipline and profitability than for speed of growth or recent stock performance. Quality measures are strong for the sector, with profit margin near 19% to 20%, operating margin above the utility median, and leverage clearly below many regulated peers. By contrast, value measures look less favorable because free cash flow is currently negative and the dividend yield is below the sector median. Momentum is weak, reflecting a share price that has lagged many utilities over the last year and over a multi-year period.
The stock has also been relatively low-volatility, with a beta around 0.7, which fits the profile of a smaller regulated utility. Market capitalization places the company in the smaller end of the public utility universe, large enough to access capital markets but still very tied to the economics and regulatory environment of one region.
Growth
MGE Energy operates in a sector with steady but usually modest long-term growth. Electricity demand is not a high-growth market in the traditional sense, yet utilities can still expand earnings by investing in grid modernization, cleaner generation, transmission projects, and reliability upgrades that are added to the regulated asset base. In that context, MGE Energy’s strategy is logical: build and upgrade assets that regulators allow it to earn a return on, while steadily transitioning its generation fleet toward lower-carbon resources.
A major part of the long-term case is the company’s clean energy transition. MGE has continued to retire or reduce reliance on older fossil generation and invest in solar, battery storage, and other cleaner resources. That matters because utilities often create value through capital spending programs that expand the rate base over many years. It can also reduce fuel-cost exposure over time and align the company with state and customer demand for cleaner electricity.
Revenue per share has been stable with a mild upward trend over the last five years rather than showing sharp expansion. That is not unusual for a regulated utility. The more encouraging point is that book value per share has compounded at a healthy pace, indicating that MGE Energy has continued to build its underlying asset base even while revenue growth has remained modest.
Free cash flow has been volatile and is currently negative, but that should be read carefully in a utility context. Large capital spending programs often push free cash flow below zero because utilities invest heavily upfront and recover returns gradually through rates. Negative free cash flow is therefore not automatically a sign of business weakness; the key question is whether those investments are prudent, recoverable, and likely to support future earnings.
Recent company updates have pointed to continued infrastructure and renewable investment, which is the clearest catalyst for future growth. Another possible tailwind is broader electrification, including data centers, transportation, and building heating, although the timing and local scale of those demand sources are less certain than the regulated investment pipeline itself.
Risks
This article is for informational purposes only and does not constitute financial advice. Some content is AI-generated. See Disclaimer


