Stock Ranking
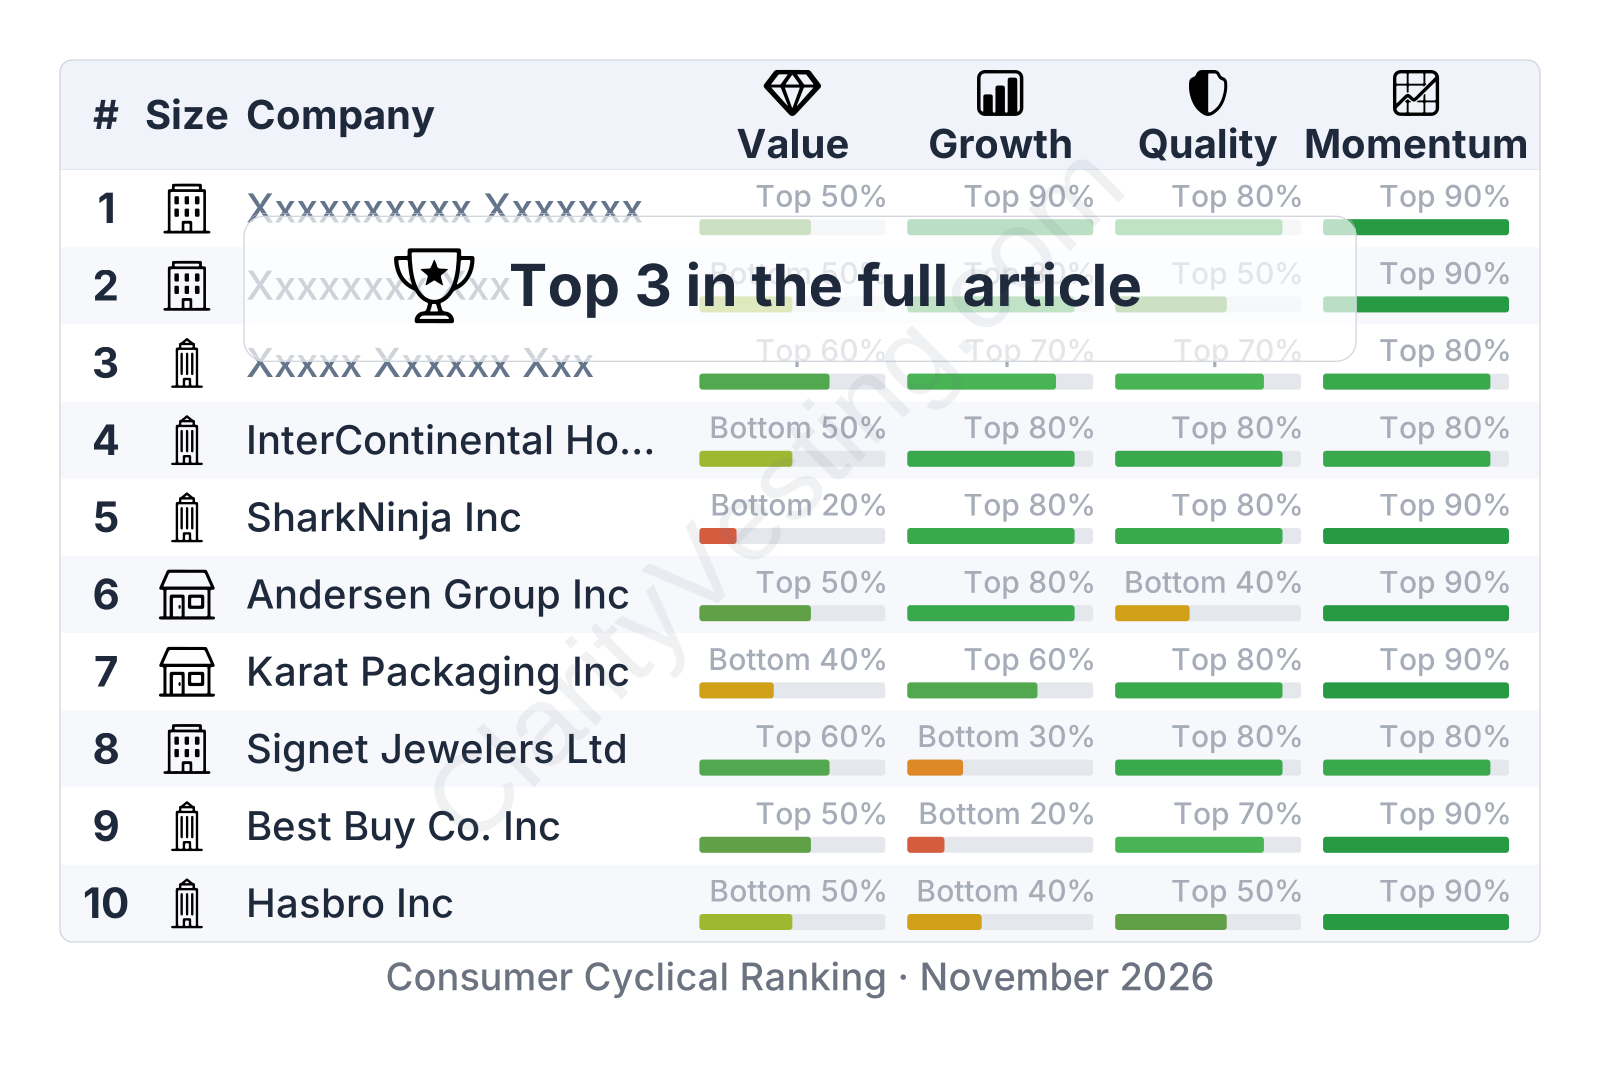
Consumer Cyclical Stock Ranking · November 2026
Published 01 Nov 2026
•
Updated 01 Nov 2026
This sector ranking is based on quantitative metrics grouped into four factors:
Value : measures how expensive a stock is relative to the company’s fundamentalsGrowth : measures how quickly the business is expandingQuality : assesses business durability, with a focus on debt levels, margins, and return on invested capitalMomentum : analyzes the current direction and strength of the stock price trendCompanies with strong fundamentals have historically delivered superior long-term performance. However, quantitative metrics alone are not sufficient to evaluate a business. Understanding how a company operates, along with its catalysts and risks, provides a more complete picture.
Quantitative rankings should be used as a starting point for research rather than as standalone investment decisions.
The ranking includes companies across different market capitalizations. Smaller-cap stocks may offer stronger growth opportunities but generally carry higher volatility and business risk.
CopyRight:SVG Design Editor;
configurationStart;Unit=smInches;Dpi=96;Division=4;Grid=True;Zoom=5;CanvasW=122.304;CanvasH=192;configurationEnd;
Large cap
eBay Inc
+77%
5y price change
CopyRight:SVG Design Editor;
configurationStart;Unit=smInches;Dpi=96;Division=4;Grid=True;Zoom=5;CanvasW=240;CanvasH=192;configurationEnd;
Value
Bottom 30%
CopyRight:SVG Design Editor;
configurationStart;Unit=smInches;Dpi=96;Division=4;Grid=True;Zoom=5;CanvasW=193.728;CanvasH=192;configurationEnd;
Growth
Top 50%
CopyRight:SVG Design Editor;
configurationStart;Unit=smInches;Dpi=96;Division=4;Grid=True;Zoom=5;CanvasW=160.128;CanvasH=192;configurationEnd;
Quality
Top 70%
CopyRight:SVG Design Editor;
configurationStart;Unit=smInches;Dpi=96;Division=4;Grid=True;Zoom=5;CanvasW=192.672;CanvasH=192;configurationEnd;
Momentum
Top 90%
Sector Ranking
Catalysts
Ads growth, AI tools, focus
categories
Risks
Amazon pressure, high leverage, GMV
risk
Sector: Consumer Cyclical
ClarityVesting.com
eBay runs a global online marketplace centered on fees, ads, and seller services. Its current profile pairs strong margins, solid cash generation, and improving revenue momentum, with growth increasingly linked to collectibles, parts, and AI-powered platform upgrades.
Stock analysis eBay Inc
CopyRight:SVG Design Editor;
configurationStart;Unit=smInches;Dpi=96;Division=4;Grid=True;Zoom=5;CanvasW=122.304;CanvasH=192;configurationEnd;
Large cap
Marriott International Inc
+160%
5y price change
CopyRight:SVG Design Editor;
configurationStart;Unit=smInches;Dpi=96;Division=4;Grid=True;Zoom=5;CanvasW=240;CanvasH=192;configurationEnd;
Value
Bottom 20%
CopyRight:SVG Design Editor;
configurationStart;Unit=smInches;Dpi=96;Division=4;Grid=True;Zoom=5;CanvasW=193.728;CanvasH=192;configurationEnd;
Growth
Top 80%
CopyRight:SVG Design Editor;
configurationStart;Unit=smInches;Dpi=96;Division=4;Grid=True;Zoom=5;CanvasW=160.128;CanvasH=192;configurationEnd;
Quality
Top 60%
CopyRight:SVG Design Editor;
configurationStart;Unit=smInches;Dpi=96;Division=4;Grid=True;Zoom=5;CanvasW=192.672;CanvasH=192;configurationEnd;
Momentum
Top 80%
Sector Ranking
Catalysts
Room growth, Bonvoy, global
expansion
Risks
Travel slowdown, leverage,
competition
Sector: Consumer Cyclical
ClarityVesting.com
Marriott is a global hotel leader built around brands, management fees, and the Marriott Bonvoy ecosystem. High margins, strong cash generation, and continued room expansion support a compelling long-term business profile, even as the valuation leaves little room for missteps.
Stock analysis Marriott International Inc
CopyRight:SVG Design Editor;
configurationStart;Unit=smInches;Dpi=96;Division=4;Grid=True;Zoom=5;CanvasW=122.304;CanvasH=192;configurationEnd;
Large cap
General Motors Company
+64%
5y price change
CopyRight:SVG Design Editor;
configurationStart;Unit=smInches;Dpi=96;Division=4;Grid=True;Zoom=5;CanvasW=240;CanvasH=192;configurationEnd;
Value
Top 60%
CopyRight:SVG Design Editor;
configurationStart;Unit=smInches;Dpi=96;Division=4;Grid=True;Zoom=5;CanvasW=193.728;CanvasH=192;configurationEnd;
Growth
Top 80%
CopyRight:SVG Design Editor;
configurationStart;Unit=smInches;Dpi=96;Division=4;Grid=True;Zoom=5;CanvasW=160.128;CanvasH=192;configurationEnd;
Quality
Bottom 10%
CopyRight:SVG Design Editor;
configurationStart;Unit=smInches;Dpi=96;Division=4;Grid=True;Zoom=5;CanvasW=192.672;CanvasH=192;configurationEnd;
Momentum
Top 80%
Sector Ranking
Catalysts
EV scale-up, truck mix, cash flow
strength
Risks
Thin margins, high leverage, EV
execution
Sector: Consumer Cyclical
ClarityVesting.com
General Motors is a large global automaker built around profitable North American trucks and SUVs, supported by GM Financial. Strong recent cash generation and a broad EV and software push make its long-term direction especially notable to examine.
Stock analysis General Motors Company
CopyRight:SVG Design Editor;
configurationStart;Unit=smInches;Dpi=96;Division=4;Grid=True;Zoom=5;CanvasW=180.864;CanvasH=192;configurationEnd;
Mid cap
Versigent PLC
+36%
5y price change
CopyRight:SVG Design Editor;
configurationStart;Unit=smInches;Dpi=96;Division=4;Grid=True;Zoom=5;CanvasW=240;CanvasH=192;configurationEnd;
Value
Top 60%
CopyRight:SVG Design Editor;
configurationStart;Unit=smInches;Dpi=96;Division=4;Grid=True;Zoom=5;CanvasW=193.728;CanvasH=192;configurationEnd;
Growth
Bottom 40%
CopyRight:SVG Design Editor;
configurationStart;Unit=smInches;Dpi=96;Division=4;Grid=True;Zoom=5;CanvasW=160.128;CanvasH=192;configurationEnd;
Quality
Top 50%
CopyRight:SVG Design Editor;
configurationStart;Unit=smInches;Dpi=96;Division=4;Grid=True;Zoom=5;CanvasW=192.672;CanvasH=192;configurationEnd;
Momentum
Top 80%
Sector Ranking
Catalysts
FCF strength, margin recovery, R&D
support
Risks
Leverage volatility, auto cycle
exposure
Sector: Consumer Cyclical
ClarityVesting.com
Versigent is a scaled auto parts supplier generating strong cash flow and high returns on capital. Recent results show improving margins and resilient revenue, while the valuation remains low on earnings, keeping attention on its operating recovery and cash generation.
Stock analysis Versigent PLC
CopyRight:SVG Design Editor;
configurationStart;Unit=smInches;Dpi=96;Division=4;Grid=True;Zoom=5;CanvasW=180.864;CanvasH=192;configurationEnd;
Mid cap
H&R Block Inc
+166%
5y price change
CopyRight:SVG Design Editor;
configurationStart;Unit=smInches;Dpi=96;Division=4;Grid=True;Zoom=5;CanvasW=240;CanvasH=192;configurationEnd;
Value
Top 60%
CopyRight:SVG Design Editor;
configurationStart;Unit=smInches;Dpi=96;Division=4;Grid=True;Zoom=5;CanvasW=193.728;CanvasH=192;configurationEnd;
Growth
Top 70%
CopyRight:SVG Design Editor;
configurationStart;Unit=smInches;Dpi=96;Division=4;Grid=True;Zoom=5;CanvasW=160.128;CanvasH=192;configurationEnd;
Quality
Top 90%
CopyRight:SVG Design Editor;
configurationStart;Unit=smInches;Dpi=96;Division=4;Grid=True;Zoom=5;CanvasW=192.672;CanvasH=192;configurationEnd;
Momentum
Top 70%
Sector Ranking
Catalysts
DIY growth, Wave expansion, AI tax
tools
Risks
Free filing, TurboTax pressure,
seasonality
Sector: Consumer Cyclical
ClarityVesting.com
H&R Block provides assisted and DIY tax filing, backed by a large U.S. brand and a growing small-business platform through Wave. Strong margins, high returns on capital, and solid cash generation give the company an operating profile that stands out more than its mature market might suggest.
Stock analysis H&R Block Inc
CopyRight:SVG Design Editor;
configurationStart;Unit=smInches;Dpi=96;Division=4;Grid=True;Zoom=5;CanvasW=180.864;CanvasH=192;configurationEnd;
Mid cap
Interface Inc
+154%
5y price change
CopyRight:SVG Design Editor;
configurationStart;Unit=smInches;Dpi=96;Division=4;Grid=True;Zoom=5;CanvasW=240;CanvasH=192;configurationEnd;
Value
Bottom 40%
CopyRight:SVG Design Editor;
configurationStart;Unit=smInches;Dpi=96;Division=4;Grid=True;Zoom=5;CanvasW=193.728;CanvasH=192;configurationEnd;
Growth
Top 50%
CopyRight:SVG Design Editor;
configurationStart;Unit=smInches;Dpi=96;Division=4;Grid=True;Zoom=5;CanvasW=160.128;CanvasH=192;configurationEnd;
Quality
Top 50%
CopyRight:SVG Design Editor;
configurationStart;Unit=smInches;Dpi=96;Division=4;Grid=True;Zoom=5;CanvasW=192.672;CanvasH=192;configurationEnd;
Momentum
Top 90%
Sector Ranking
Catalysts
LVT expansion, margin gains, cash
flow
Risks
Commercial cycle, pricing pressure,
office
Sector: Consumer Cyclical
ClarityVesting.com
Interface makes commercial flooring led by carpet tile, with growing exposure to luxury vinyl tile and a strong sustainability profile. In recent years, margins improved, cash flow rose, and leverage fell sharply, underscoring the company’s operating progress.
Stock analysis Interface Inc
CopyRight:SVG Design Editor;
configurationStart;Unit=smInches;Dpi=96;Division=4;Grid=True;Zoom=5;CanvasW=180.864;CanvasH=192;configurationEnd;
Mid cap
Frontdoor Inc
+122%
5y price change
CopyRight:SVG Design Editor;
configurationStart;Unit=smInches;Dpi=96;Division=4;Grid=True;Zoom=5;CanvasW=240;CanvasH=192;configurationEnd;
Value
Bottom 40%
CopyRight:SVG Design Editor;
configurationStart;Unit=smInches;Dpi=96;Division=4;Grid=True;Zoom=5;CanvasW=193.728;CanvasH=192;configurationEnd;
Growth
Top 80%
CopyRight:SVG Design Editor;
configurationStart;Unit=smInches;Dpi=96;Division=4;Grid=True;Zoom=5;CanvasW=160.128;CanvasH=192;configurationEnd;
Quality
Top 80%
CopyRight:SVG Design Editor;
configurationStart;Unit=smInches;Dpi=96;Division=4;Grid=True;Zoom=5;CanvasW=192.672;CanvasH=192;configurationEnd;
Momentum
Top 90%
Sector Ranking
Catalysts
Aging homes, renewals, cash flow
growth
Risks
Claims inflation, leverage,
reputation
Sector: Consumer Cyclical
ClarityVesting.com
Frontdoor sells home warranty plans and related repair services through well-known brands led by American Home Shield. Its long-term profile rests on improving profitability, strong cash generation, and a business tied to the ongoing need to maintain aging homes.
Stock analysis Frontdoor Inc
CopyRight:SVG Design Editor;
configurationStart;Unit=smInches;Dpi=96;Division=4;Grid=True;Zoom=5;CanvasW=122.304;CanvasH=192;configurationEnd;
Large cap
Williams-Sonoma Inc
+186%
5y price change
CopyRight:SVG Design Editor;
configurationStart;Unit=smInches;Dpi=96;Division=4;Grid=True;Zoom=5;CanvasW=240;CanvasH=192;configurationEnd;
Value
Bottom 30%
CopyRight:SVG Design Editor;
configurationStart;Unit=smInches;Dpi=96;Division=4;Grid=True;Zoom=5;CanvasW=193.728;CanvasH=192;configurationEnd;
Growth
Bottom 30%
CopyRight:SVG Design Editor;
configurationStart;Unit=smInches;Dpi=96;Division=4;Grid=True;Zoom=5;CanvasW=160.128;CanvasH=192;configurationEnd;
Quality
Top 90%
CopyRight:SVG Design Editor;
configurationStart;Unit=smInches;Dpi=96;Division=4;Grid=True;Zoom=5;CanvasW=192.672;CanvasH=192;configurationEnd;
Momentum
Top 90%
Sector Ranking
Catalysts
B2B expansion, digital strength,
margin resilience
Risks
Housing slowdown, premium demand,
margin reset
Sector: Consumer Cyclical
ClarityVesting.com
Williams-Sonoma is a premium home retailer with a powerful digital model, strong brands, and unusually high profitability for the sector. The analysis looks at how cash generation, brand depth, and disciplined execution shape its long-term profile.
Stock analysis Williams-Sonoma Inc
CopyRight:SVG Design Editor;
configurationStart;Unit=smInches;Dpi=96;Division=4;Grid=True;Zoom=5;CanvasW=216.096;CanvasH=192;configurationEnd;
Small cap
Myers Industries Inc
+63%
5y price change
CopyRight:SVG Design Editor;
configurationStart;Unit=smInches;Dpi=96;Division=4;Grid=True;Zoom=5;CanvasW=240;CanvasH=192;configurationEnd;
Value
Bottom 50%
CopyRight:SVG Design Editor;
configurationStart;Unit=smInches;Dpi=96;Division=4;Grid=True;Zoom=5;CanvasW=193.728;CanvasH=192;configurationEnd;
Growth
Bottom 50%
CopyRight:SVG Design Editor;
configurationStart;Unit=smInches;Dpi=96;Division=4;Grid=True;Zoom=5;CanvasW=160.128;CanvasH=192;configurationEnd;
Quality
Bottom 50%
CopyRight:SVG Design Editor;
configurationStart;Unit=smInches;Dpi=96;Division=4;Grid=True;Zoom=5;CanvasW=192.672;CanvasH=192;configurationEnd;
Momentum
Top 90%
Sector Ranking
Catalysts
Margin recovery, debt reduction,
integration gains
Risks
High leverage, cyclical demand,
margin swings
Sector: Consumer Cyclical
ClarityVesting.com
Myers Industries makes reusable plastic material-handling products and distributes vehicle service supplies. Better cash flow, margins, and share performance have brought new attention to a business with durable niche positions and room for further operational progress.
Stock analysis Myers Industries Inc
CopyRight:SVG Design Editor;
configurationStart;Unit=smInches;Dpi=96;Division=4;Grid=True;Zoom=5;CanvasW=180.864;CanvasH=192;configurationEnd;
Mid cap
The Cheesecake Factory
+208%
5y price change
CopyRight:SVG Design Editor;
configurationStart;Unit=smInches;Dpi=96;Division=4;Grid=True;Zoom=5;CanvasW=240;CanvasH=192;configurationEnd;
Value
Bottom 30%
CopyRight:SVG Design Editor;
configurationStart;Unit=smInches;Dpi=96;Division=4;Grid=True;Zoom=5;CanvasW=193.728;CanvasH=192;configurationEnd;
Growth
Top 60%
CopyRight:SVG Design Editor;
configurationStart;Unit=smInches;Dpi=96;Division=4;Grid=True;Zoom=5;CanvasW=160.128;CanvasH=192;configurationEnd;
Quality
Top 60%
CopyRight:SVG Design Editor;
configurationStart;Unit=smInches;Dpi=96;Division=4;Grid=True;Zoom=5;CanvasW=192.672;CanvasH=192;configurationEnd;
Momentum
Top 90%
Sector Ranking
Catalysts
North Italia, Flower Child, FCF
rebound
Risks
High leverage, thin margins, weak
traffic
Sector: Consumer Cyclical
ClarityVesting.com
The Cheesecake Factory combines a well-known flagship brand with expanding concepts like North Italia and Flower Child. Sales and free cash flow have improved, giving the company a broader long-term profile than many casual dining peers and highlighting an evolution worth examining.
Stock analysis The Cheesecake Factory
CopyRight:SVG Design Editor;
configurationStart;Unit=smInches;Dpi=96;Division=4;Grid=True;Zoom=5;CanvasW=122.304;CanvasH=192;configurationEnd;
Large cap
Hasbro Inc
+55%
5y price change
CopyRight:SVG Design Editor;
configurationStart;Unit=smInches;Dpi=96;Division=4;Grid=True;Zoom=5;CanvasW=240;CanvasH=192;configurationEnd;
Value
Bottom 50%
CopyRight:SVG Design Editor;
configurationStart;Unit=smInches;Dpi=96;Division=4;Grid=True;Zoom=5;CanvasW=193.728;CanvasH=192;configurationEnd;
Growth
Bottom 40%
CopyRight:SVG Design Editor;
configurationStart;Unit=smInches;Dpi=96;Division=4;Grid=True;Zoom=5;CanvasW=160.128;CanvasH=192;configurationEnd;
Quality
Top 50%
CopyRight:SVG Design Editor;
configurationStart;Unit=smInches;Dpi=96;Division=4;Grid=True;Zoom=5;CanvasW=192.672;CanvasH=192;configurationEnd;
Momentum
Top 90%
Sector Ranking
Catalysts
Magic growth, licensing, cash
recovery
Risks
High leverage, toy cyclicality,
brand missteps
Sector: Consumer Cyclical
ClarityVesting.com
Hasbro combines classic toys with high-margin franchises like Magic: The Gathering and Dungeons & Dragons. Margins and cash flow have rebounded, and brand monetization now stretches across cards, digital play, and licensing, making the business more resilient than before.
Stock analysis Hasbro Inc
CopyRight:SVG Design Editor;
configurationStart;Unit=smInches;Dpi=96;Division=4;Grid=True;Zoom=5;CanvasW=122.304;CanvasH=192;configurationEnd;
Large cap
Best Buy Co. Inc
-2%
5y price change
CopyRight:SVG Design Editor;
configurationStart;Unit=smInches;Dpi=96;Division=4;Grid=True;Zoom=5;CanvasW=240;CanvasH=192;configurationEnd;
Value
Top 50%
CopyRight:SVG Design Editor;
configurationStart;Unit=smInches;Dpi=96;Division=4;Grid=True;Zoom=5;CanvasW=193.728;CanvasH=192;configurationEnd;
Growth
Bottom 20%
CopyRight:SVG Design Editor;
configurationStart;Unit=smInches;Dpi=96;Division=4;Grid=True;Zoom=5;CanvasW=160.128;CanvasH=192;configurationEnd;
Quality
Top 70%
CopyRight:SVG Design Editor;
configurationStart;Unit=smInches;Dpi=96;Division=4;Grid=True;Zoom=5;CanvasW=192.672;CanvasH=192;configurationEnd;
Momentum
Top 90%
Sector Ranking
Catalysts
AI PC cycle, memberships, services
Risks
Thin margins, Amazon pressure, weak
demand
Sector: Consumer Cyclical
ClarityVesting.com
Best Buy is a major electronics retailer combining product sales with services, installation, and memberships. Recent results suggest stabilizing revenue, solid cash generation, and strong capital efficiency, giving the company a sturdier profile than raw growth figures imply.
Stock analysis Best Buy Co. Inc
CopyRight:SVG Design Editor;
configurationStart;Unit=smInches;Dpi=96;Division=4;Grid=True;Zoom=5;CanvasW=180.864;CanvasH=192;configurationEnd;
Mid cap
Signet Jewelers Ltd
+29%
5y price change
CopyRight:SVG Design Editor;
configurationStart;Unit=smInches;Dpi=96;Division=4;Grid=True;Zoom=5;CanvasW=240;CanvasH=192;configurationEnd;
Value
Top 60%
CopyRight:SVG Design Editor;
configurationStart;Unit=smInches;Dpi=96;Division=4;Grid=True;Zoom=5;CanvasW=193.728;CanvasH=192;configurationEnd;
Growth
Bottom 30%
CopyRight:SVG Design Editor;
configurationStart;Unit=smInches;Dpi=96;Division=4;Grid=True;Zoom=5;CanvasW=160.128;CanvasH=192;configurationEnd;
Quality
Top 80%
CopyRight:SVG Design Editor;
configurationStart;Unit=smInches;Dpi=96;Division=4;Grid=True;Zoom=5;CanvasW=192.672;CanvasH=192;configurationEnd;
Momentum
Top 80%
Sector Ranking
Catalysts
Bridal recovery, services mix,
digital gains
Risks
Weak discretionary demand, margin
swings
Sector: Consumer Cyclical
ClarityVesting.com
Signet Jewelers is the largest U.S. specialty jewelry retailer, combining major brands, bridal exposure, national scale, and solid cash generation. The analysis explores whether its low valuation reflects temporary normalization or a more lasting growth challenge.
Stock analysis Signet Jewelers Ltd
CopyRight:SVG Design Editor;
configurationStart;Unit=smInches;Dpi=96;Division=4;Grid=True;Zoom=5;CanvasW=216.096;CanvasH=192;configurationEnd;
Small cap
Karat Packaging Inc
+205%
5y price change
CopyRight:SVG Design Editor;
configurationStart;Unit=smInches;Dpi=96;Division=4;Grid=True;Zoom=5;CanvasW=240;CanvasH=192;configurationEnd;
Value
Bottom 40%
CopyRight:SVG Design Editor;
configurationStart;Unit=smInches;Dpi=96;Division=4;Grid=True;Zoom=5;CanvasW=193.728;CanvasH=192;configurationEnd;
Growth
Top 60%
CopyRight:SVG Design Editor;
configurationStart;Unit=smInches;Dpi=96;Division=4;Grid=True;Zoom=5;CanvasW=160.128;CanvasH=192;configurationEnd;
Quality
Top 80%
CopyRight:SVG Design Editor;
configurationStart;Unit=smInches;Dpi=96;Division=4;Grid=True;Zoom=5;CanvasW=192.672;CanvasH=192;configurationEnd;
Momentum
Top 90%
Sector Ranking
Catalysts
Custom packaging, beverage shop
exposure
Risks
Commodity pricing, freight and
input costs
Sector: Consumer Cyclical
ClarityVesting.com
Karat Packaging supplies the disposable cups, containers, utensils, and branded packaging used by foodservice businesses. Recent analysis highlights rising sales, strong margins, healthy cash generation, and a balance sheet that stacks up well against many peers.
Stock analysis Karat Packaging Inc
CopyRight:SVG Design Editor;
configurationStart;Unit=smInches;Dpi=96;Division=4;Grid=True;Zoom=5;CanvasW=216.096;CanvasH=192;configurationEnd;
Small cap
Andersen Group Inc
+310%
5y price change
CopyRight:SVG Design Editor;
configurationStart;Unit=smInches;Dpi=96;Division=4;Grid=True;Zoom=5;CanvasW=240;CanvasH=192;configurationEnd;
Value
Top 50%
CopyRight:SVG Design Editor;
configurationStart;Unit=smInches;Dpi=96;Division=4;Grid=True;Zoom=5;CanvasW=193.728;CanvasH=192;configurationEnd;
Growth
Top 80%
CopyRight:SVG Design Editor;
configurationStart;Unit=smInches;Dpi=96;Division=4;Grid=True;Zoom=5;CanvasW=160.128;CanvasH=192;configurationEnd;
Quality
Bottom 40%
CopyRight:SVG Design Editor;
configurationStart;Unit=smInches;Dpi=96;Division=4;Grid=True;Zoom=5;CanvasW=192.672;CanvasH=192;configurationEnd;
Momentum
Top 90%
Sector Ranking
Catalysts
Margin recovery, service demand,
cash flow
Risks
Margin collapse, leverage swings,
rivals
Sector: Consumer Cyclical
ClarityVesting.com
Andersen Group provides transportation-related services tied to vehicle logistics, inspection, and support programs. Revenue growth and cash flow have been strong, while the market has sharply rerated the shares, putting particular emphasis on the margin-recovery question.
Stock analysis Andersen Group Inc
CopyRight:SVG Design Editor;
configurationStart;Unit=smInches;Dpi=96;Division=4;Grid=True;Zoom=5;CanvasW=122.304;CanvasH=192;configurationEnd;
Large cap
SharkNinja Inc
+403%
5y price change
CopyRight:SVG Design Editor;
configurationStart;Unit=smInches;Dpi=96;Division=4;Grid=True;Zoom=5;CanvasW=240;CanvasH=192;configurationEnd;
Value
Bottom 20%
CopyRight:SVG Design Editor;
configurationStart;Unit=smInches;Dpi=96;Division=4;Grid=True;Zoom=5;CanvasW=193.728;CanvasH=192;configurationEnd;
Growth
Top 80%
CopyRight:SVG Design Editor;
configurationStart;Unit=smInches;Dpi=96;Division=4;Grid=True;Zoom=5;CanvasW=160.128;CanvasH=192;configurationEnd;
Quality
Top 80%
CopyRight:SVG Design Editor;
configurationStart;Unit=smInches;Dpi=96;Division=4;Grid=True;Zoom=5;CanvasW=192.672;CanvasH=192;configurationEnd;
Momentum
Top 90%
Sector Ranking
Catalysts
Intl expansion, new products,
category gains
Risks
Premium valuation, competition,
tariffs
Sector: Consumer Cyclical
ClarityVesting.com
SharkNinja sells Shark and Ninja household appliances across cleaning, cooking, and home categories. Rapid product launches, rising margins, strong cash generation, and expanding international reach make it one of the more dynamic names in consumer appliances.
Stock analysis SharkNinja Inc
CopyRight:SVG Design Editor;
configurationStart;Unit=smInches;Dpi=96;Division=4;Grid=True;Zoom=5;CanvasW=122.304;CanvasH=192;configurationEnd;
Large cap
InterContinental Hotels Group PLC
+161%
5y price change
CopyRight:SVG Design Editor;
configurationStart;Unit=smInches;Dpi=96;Division=4;Grid=True;Zoom=5;CanvasW=240;CanvasH=192;configurationEnd;
Value
Bottom 50%
CopyRight:SVG Design Editor;
configurationStart;Unit=smInches;Dpi=96;Division=4;Grid=True;Zoom=5;CanvasW=193.728;CanvasH=192;configurationEnd;
Growth
Top 80%
CopyRight:SVG Design Editor;
configurationStart;Unit=smInches;Dpi=96;Division=4;Grid=True;Zoom=5;CanvasW=160.128;CanvasH=192;configurationEnd;
Quality
Top 80%
CopyRight:SVG Design Editor;
configurationStart;Unit=smInches;Dpi=96;Division=4;Grid=True;Zoom=5;CanvasW=192.672;CanvasH=192;configurationEnd;
Momentum
Top 90%
Sector Ranking
Catalysts
Luxury growth, room pipeline,
loyalty scale
Risks
Travel slowdown, premium valuation,
rivals
Sector: Consumer Cyclical
ClarityVesting.com
IHG is a global hotel group built on an asset-light model that turns brands, loyalty, and owner relationships into recurring fees. Strong margins, cash generation, and room growth ambitions give its long-term business profile particular depth.
Stock analysis InterContinental Hotels Group PLC
This article is for informational purposes only and does not constitute financial advice. Some content is AI-generated. See Disclaimer