Stock Analysis · Versigent PLC (VGNT)
Overview
Versigent PLC operates in the auto parts industry within the broader consumer cyclical sector. In practical terms, that means the company makes and sells components used by vehicle manufacturers and the automotive aftermarket. Based on its financial profile, it appears to be a scaled supplier with meaningful manufacturing activity, ongoing engineering spending, and exposure to vehicle production volumes rather than a pure software or services business.
The clearest public financial split available here is not by product family, but by how revenue turns into profit. That still helps explain the business model: Versigent generates sales from automotive parts, then absorbs large production and operating costs before reaching earnings and cash flow.
- Revenue: about $8.8 billion in 2025.
- Cost of revenue: about $7.7 billion, or roughly 88% of revenue, showing a manufacturing-heavy business with significant input and production costs.
- Gross profit: about $1.1 billion, or roughly 12% of revenue.
- Research and development: about $274 million in 2025, equal to roughly 3% of revenue, suggesting regular investment in product design and engineering.
- Selling, general and administrative expense: about $419 million, or roughly 5% of revenue.
- Operating income: about $670 million, or roughly 8% of revenue.
- Net income: about $528 million, or roughly 6% of revenue.
Over the last four reported years, revenue moved from roughly $8.0 billion to $8.8 billion. That is not a straight line, but it does show resilience through a cyclical industry. Profitability also improved in 2025 compared with 2024, with gross profit, operating income, and net income all recovering.
One notable feature is cash generation. Free cash flow is strong relative to the company’s size, which matters in a parts business where capital needs, working capital swings, and customer concentration can otherwise pressure returns.
The operating picture suggests a company with high manufacturing intensity but decent discipline: costs take most of the revenue base, yet the business still converts a meaningful portion of sales into operating profit and cash. The rebound from 2024 to 2025 also suggests margin recovery rather than purely volume-driven growth.
Key Figures
| Metric | Value | Sector ⓘ |
|---|---|---|
| Date | Oct 17, 2026 | |
| Context | ||
| Sector | Consumer Cyclical | |
| Industry | Auto Parts | |
| Market Cap ⓘ | $3.08B | |
| Beta ⓘ | N/A | |
Value (Cheapness) | ||
| P/E Ratio ⓘ | 6.24 | 16.89 |
| P/B Ratio ⓘ | 39.52 | 1.61 |
| FCF Yield ⓘ | 14.53% | 8.99% |
| Dividend Yield ⓘ | 0.29% | 2.73% |
| EBIT / EV ⓘ | 14.47% | 6.69% |
| PEG ⓘ | N/A | |
Growth (Business expansion) | ||
| Revenue Growth ⓘ | 10.80% | 5.60% |
| RPS Growth (5Y CAGR) ⓘ | 3.23% | 8.91% |
| EPS Growth (5Y CAGR) ⓘ | N/A | -17.41% |
| BVPS Growth (5Y CAGR) ⓘ | -4.30% | 5.62% |
| Margin Growth (5Y Trend) ⓘ | 1.12% | -0.17% |
| FCF Growth (5Y CAGR) ⓘ | 7.89% | 4.91% |
| DPS Growth (5Y CAGR) ⓘ | N/A | 9.86% |
Quality (Business durability) | ||
| ROIC (Latest) ⓘ | 37.32% | 12.38% |
| ROA (Latest) ⓘ | 10.51% | 5.49% |
| ROIC (5Y Median) ⓘ | N/A | 10.75% |
| ROA (5Y Median) ⓘ | N/A | 5.44% |
| Net Debt / EBIT (Latest) ⓘ | 2.51 | 2.17 |
| Net Debt / EBIT (5Y Median) ⓘ | 0.09 | 2.30 |
| Net Debt / EBITDA (Latest) ⓘ | 1.92 | 1.50 |
| Net Debt / Assets ⓘ | 34.88% | 21.57% |
| EBITDA / Interest ⓘ | N/A | 9.13 |
| Operating Margin (Latest) ⓘ | 8.05% | 9.10% |
| Operating Margin (5Y Median) ⓘ | 7.04% | 9.56% |
| Debt to Equity (Latest) ⓘ | 2850.59% | 75.99% |
| Profit Margin (Latest) ⓘ | 5.65% | 5.31% |
| Free Cash Flow (Latest) ⓘ | $447.00M | |
Momentum (Price trend) | ||
| 3Y Return ⓘ | N/A | +15.94% |
| 12M Return (excl. last month) ⓘ | N/A | -2.82% |
| 6M Return ⓘ | +43.41% | -1.58% |
| Price vs. 200-Day MA ⓘ | N/A | -3.31% |
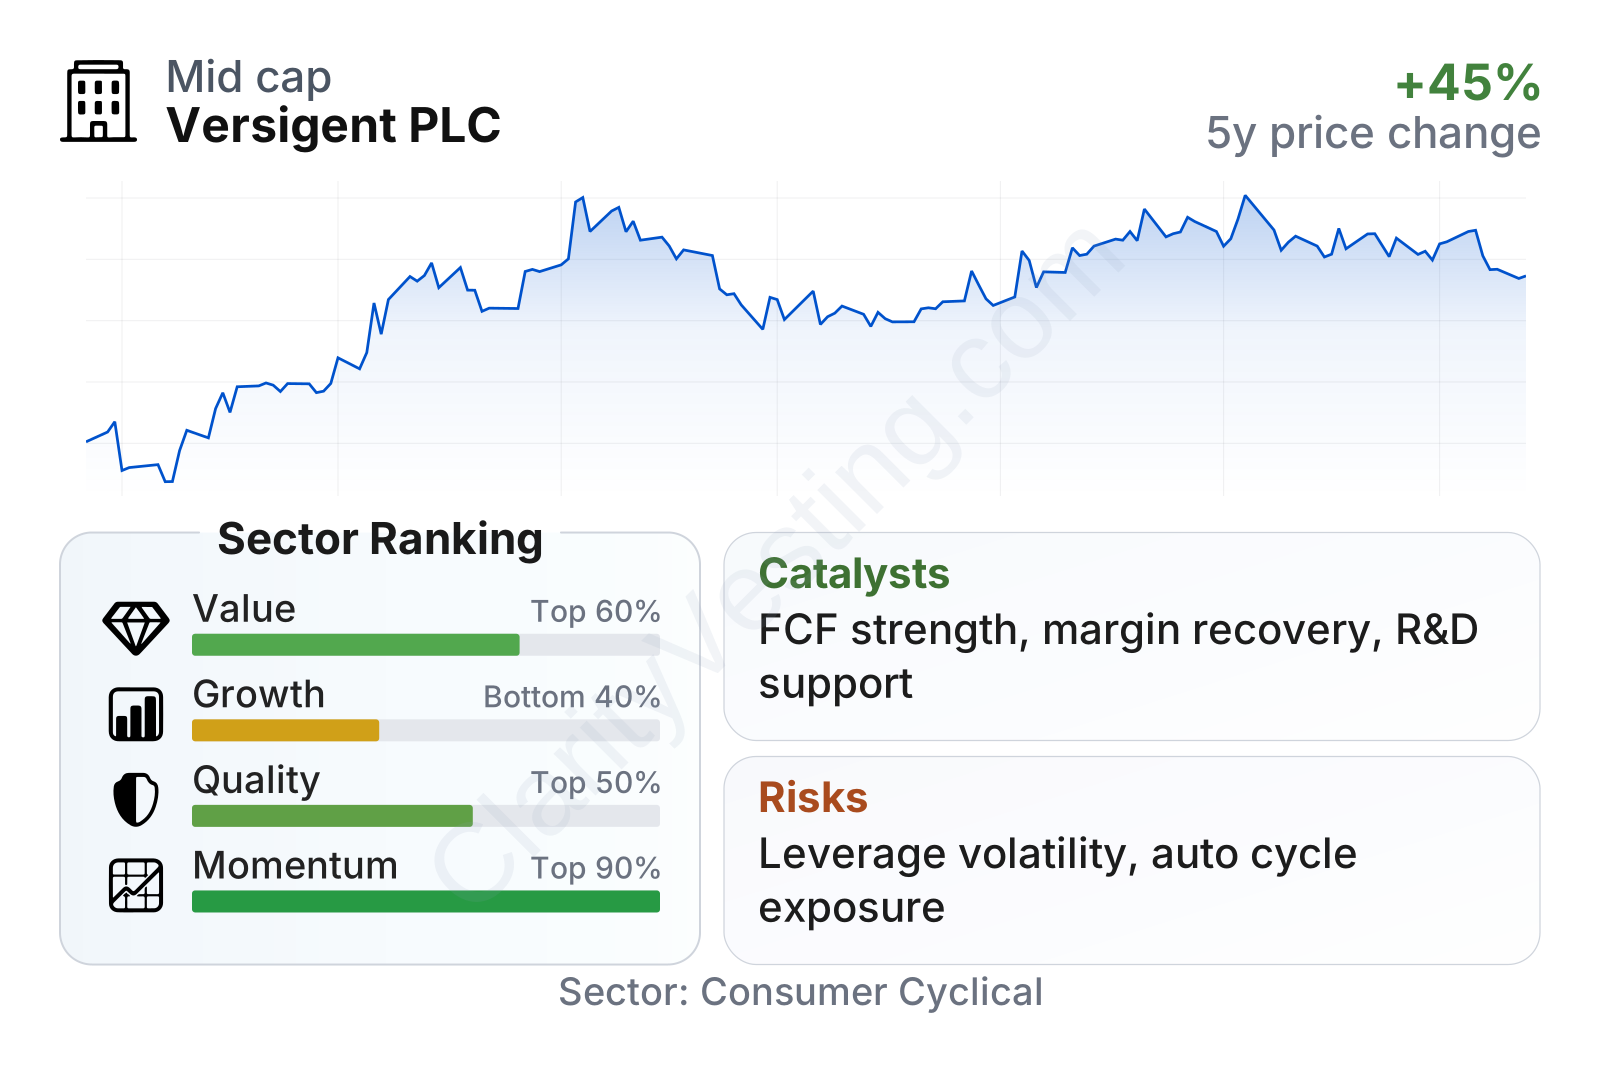
The market is valuing Versigent at a low earnings multiple relative to its sector, while free cash flow yield and EBIT relative to enterprise value are stronger than the median. That combination usually points to a stock that looks inexpensive on current profit and cash generation. At the same time, book value-based measures look unusually stretched, which often signals a thin equity base, accounting distortions, or balance sheet complexity rather than a straightforward premium valuation.
On business quality, returns on invested capital and returns on assets stand well above sector norms, which is encouraging for a manufacturer. Recent revenue growth is also ahead of the sector median, but the longer five-year growth profile is less impressive. In other words, current performance has improved, yet the longer record still looks more mixed than exceptional.
Growth
The automotive parts industry is not a structurally fast-growth market in the same way as cloud software or semiconductors, but it can still offer durable expansion when suppliers align with the right themes. The most important long-term drivers are usually rising vehicle electronics content, efficiency requirements, electrification, replacement demand in the aftermarket, and continued outsourcing by carmakers to specialized suppliers.
Versigent’s strategy appears sensible if judged through its spending patterns and recent results. The company continues to invest in research and development, and its recent year-over-year revenue growth of about 11% is ahead of the sector median. That does not automatically make it a high-growth company, but it does suggest it is currently capturing demand better than many peers.
There is also evidence of improving execution. Revenue in 2025 returned to roughly the 2023 level, but profits and free cash flow improved versus 2024. That can indicate a better product mix, cost control, or more favorable customer programs. For a long-term assessment, this matters because auto suppliers often create most of their value through disciplined margin management rather than dramatic top-line growth.
A possible catalyst is the company’s ability to keep converting sales into cash at a high rate. Free cash flow of roughly $447 million against a market value a little above $3 billion stands out. If that cash generation remains durable, it can support debt reduction, internal investment, and resilience during softer production cycles.
Another positive element is that operating margin trends over the last five years have improved while the sector median trend was weaker. That does not remove cyclicality, but it suggests management has made at least some progress in operating efficiency.
Risks
This article is for informational purposes only and does not constitute financial advice. Some content is AI-generated. See Disclaimer


