Stock Analysis · Myers Industries Inc (MYE)
Stock Analysis · Myers Industries Inc (MYE)

Overview

Myers Industries is a manufacturing company focused on polymer-based products. In simple terms, it makes plastic containers, reusable packaging, storage and material-handling products, and a range of products used in agriculture, automotive aftermarket, food processing, industrial operations, and consumer-related end markets. The business has historically been built around durable, molded products rather than fast-changing consumer brands, which gives it a more industrial profile than its sector label might suggest.

The company reports through two main business segments. Material Handling is the larger operation and includes reusable containers, pallets, bins, tanks, and other molded products used to move, store, and protect goods. Distribution is the smaller segment and serves the tire, wheel, and under-vehicle service equipment market. That mix means Myers is exposed both to industrial activity and to replacement-driven automotive demand.

Based on recent company reporting, the revenue mix is approximately as follows:

  • Material Handling: roughly three-quarters to four-fifths of total revenue. This is the core business and the main earnings engine.
  • Distribution: roughly one-fifth to one-quarter of total revenue. This business is more tied to automotive aftermarket and service channels.

From a broader perspective, Myers earns most of its money from selling physical products rather than recurring software-like revenue. That makes margins more sensitive to plant efficiency, resin costs, freight, and overall customer demand. Over the last several years, revenue has moved within a fairly narrow band after the 2022 peak, while profitability has been more volatile. The long-term appeal of the business rests on niche manufacturing positions, a wide installed customer base, and the ability to improve operations and product mix over time.

The business flow shows a useful pattern: sales have stayed relatively stable after the 2022 high, but earnings have swung much more sharply. In 2024, operating income and net income weakened significantly, with interest expense becoming a much larger drag. In 2025, profit recovered, helped by tighter operating costs, but the gap between operating profit and net profit still shows how important debt costs remain.

Key Figures

MetricValueSector
DateJul 18, 2026
Context
SectorConsumer Cyclical
IndustryPackaging & Containers
Market Cap $1.17B
Beta 0.90
Value
(Cheapness)
P/E Ratio 28.0318.58
FCF Yield 7.58%7.99%
EBIT / EV 5.55%5.91%
PEG 4.62
Growth
(Business expansion)
Revenue Growth 1.80%5.50%
RPS Growth (5Y CAGR) 1.22%9.20%
EPS Growth (5Y CAGR) -31.83%-26.43%
Margin Growth (5Y Trend) 2.62%-0.18%
FCF Growth (5Y CAGR) 25.55%5.02%
Quality
(Business durability)
ROIC (Latest) 10.00%12.03%
ROIC (5Y Median) 12.81%10.82%
Net Debt / EBIT (Latest) 3.812.12
Net Debt / EBIT (5Y Median) 2.302.25
Operating Margin (Latest) 10.56%9.28%
Operating Margin (5Y Median) 8.91%9.64%
Debt to Equity (Latest) 124.67%75.23%
Profit Margin (Latest) 3.17%5.28%
Free Cash Flow (Latest) $88.59M
Momentum
(Price trend)
3Y Return +74.00%+10.68%
12M Return (excl. last month) +90.78%+5.26%
6M Return +57.19%-2.41%
Price vs. 200-Day MA +47.02%+1.55%
Better than sector median
Slightly worse than sector median
More than 20% worse than sector median

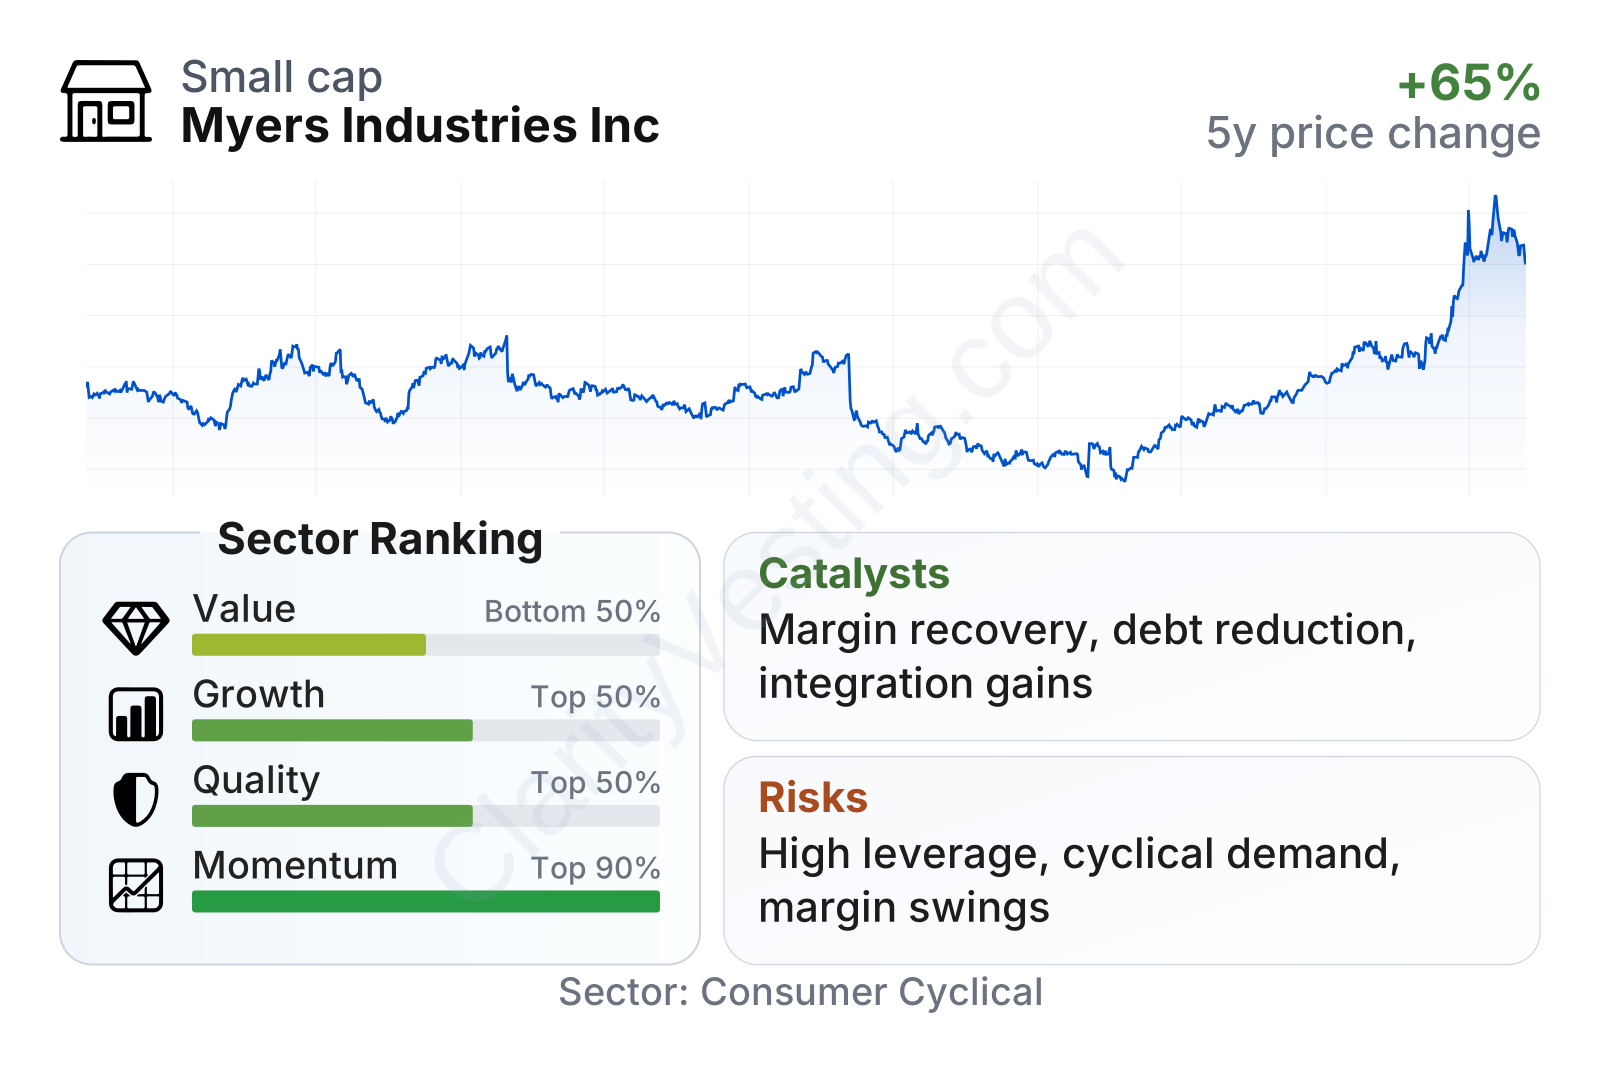
Myers currently sits in a mixed position. Market value is around $1 billion, so this is a small-cap industrial name rather than a large diversified manufacturer. The broad picture from the metrics is that cash generation looks better than accounting earnings, recent share-price momentum has been very strong, and operating margins are respectable, but leverage is elevated and overall profitability still trails many peers. Growth metrics are uneven: short-term revenue growth is soft, yet free cash flow has improved meaningfully over a multi-year period.

The stock’s recent price recovery has been sharp after a weak 2024 period. That rebound suggests the market is reacting to improving operating results and a better earnings outlook. At the same time, the table points to a business that still needs to prove that margin recovery is durable enough to support a richer valuation.

Growth

Myers operates in markets that are not usually described as high-growth, but they can still offer steady long-term expansion. Reusable packaging, material handling, and specialty molded products benefit from several structural themes: supply-chain modernization, warehouse automation, reshoring of industrial activity, demand for longer-lasting transport packaging, and agricultural efficiency. These are practical, real-economy trends rather than speculative ones, which can make growth slower but also more grounded.

The company’s strategy makes sense if viewed as a niche industrial operator. Its larger Material Handling segment is positioned in product categories where customers value reliability, customization, and replacement demand. These markets tend to reward manufacturing scale, customer relationships, and design know-how. Myers has also used acquisitions over time to broaden its product offering and end-market reach, which can support growth when integrated well.

The recent revenue trend is the biggest caution within the growth picture. Sales growth was very strong in 2021 and 2022, then turned negative through much of 2023 before stabilizing, and the latest reading shows another noticeable decline. That pattern suggests demand is still uneven and that Myers is not currently delivering smooth top-line expansion. In other words, the company’s long-term growth case relies more on operational execution, product mix, and bolt-on expansion than on a powerful natural growth rate.

Cash generation is a brighter point. Free cash flow has risen strongly from the levels seen a few years ago and recently moved to one of its best trailing figures in the period shown. That matters because for a manufacturing company, cash flow often tells a clearer story than net income alone. Stronger cash conversion can support debt reduction, facility investment, and selective acquisitions, all of which are relevant to Myers’ next phase.

As a catalyst, the most visible one is margin normalization after the difficult 2024 period. If management can keep costs under control, improve plant utilization, and maintain better pricing discipline, earnings can recover faster than revenue. Another possible support comes from end markets that are more replacement-driven than purely cyclical, especially in automotive aftermarket distribution and various industrial handling categories. The company’s recent results and communications also point to a continued focus on simplifying operations and improving productivity, which is often where meaningful value is created in this type of business.

Risks

The main risk is that Myers is a cyclical manufacturer with limited insulation from demand slowdowns. When industrial customers order less, when agricultural conditions weaken, or when automotive channels destock, revenue pressure can appear quickly. This is especially important because the business does not have a large recurring revenue base to soften downturns.

Another major issue is leverage. Debt increased materially after a low-debt period, and that has made the company more sensitive to interest costs and earnings fluctuations.

The balance sheet trend is clear: debt-to-equity moved from comfortably below sector norms earlier in the period to well above them after 2024, and although it has improved somewhat, it remains elevated. Net debt relative to EBIT is also on the high side. This does not mean the balance sheet is broken, but it does mean execution matters more. A business with higher debt has less room for operational missteps.

Profitability is another area to watch closely.

Net margin fell sharply in 2024 and has only recently climbed back toward the sector median. That rebound is encouraging, but it also shows how quickly earnings can compress when costs, volumes, or financing expenses move the wrong way. Myers’ operating margin is decent, yet its net margin still reflects thinner bottom-line protection than many peers.

On competition, Myers appears to have defensible niche positions rather than overwhelming scale leadership. It is not the dominant giant of the global packaging industry. Instead, it competes with a range of specialty plastics, material-handling, and industrial container manufacturers, along with regional distributors in automotive service channels. Large packaging and industrial product companies can compete on scale, while smaller niche firms can compete on specialization and customer intimacy. Myers’ advantage is likely strongest where custom molded products, established customer relationships, and application-specific know-how matter more than commodity pricing alone.

That also means its competitive moat looks moderate rather than exceptional. The company has useful positions in its categories, but not the kind of platform that makes competition irrelevant. If raw material costs rise sharply, if customers push back on pricing, or if acquisitions fail to deliver expected synergies, returns can come under pressure. No major public controversy or scandal stands out as a defining recent risk, but the financial and operating profile itself already presents enough areas to monitor: debt, margin durability, and uneven sales momentum.

Valuation

Valuation is where the case becomes more demanding. Myers’ earnings multiple is above the sector median, while its revenue growth remains modest and its leverage is higher than many peers. That combination usually requires confidence that profit recovery is real and sustainable, not just a short rebound from a weak base.

The historical earnings multiple shows how much sentiment has shifted. The stock traded at notably lower earnings multiples during weaker market periods, then moved to much richer levels when earnings were compressed and the share price recovered. More recently, the multiple has eased back closer to the sector range, but it is still not clearly cheap in relation to the company’s growth profile.

There is, however, a more nuanced angle. Free cash flow yield and enterprise-value-based operating earnings measures look more supportive than the plain P/E ratio. That suggests Myers may look more attractive when viewed through cash generation rather than bottom-line accounting profit. Even so, the elevated PEG ratio points to a mismatch between price and expected growth if top-line expansion remains subdued. In practical terms, the current valuation seems to assume that the company can continue repairing margins and translating that recovery into stronger earnings quality.

So the current price appears less demanding than during the peak optimism of the recent rally, but not obviously discounted given the business risks. The valuation can be justified if the recovery in margins and cash flow continues, yet it leaves less room for disappointment than a clearly depressed multiple would.

Conclusion

Myers Industries today looks like a focused niche manufacturer with credible industrial positions, solid cash generation, and a business mix anchored by its larger Material Handling segment. The company is not built around fast secular growth, but around practical product categories where efficient operations and disciplined execution can still produce worthwhile long-term progress.

The challenge is that the financial profile is not uniformly strong. Revenue momentum has been inconsistent, debt is higher than it used to be, and bottom-line profitability only recently recovered from a sharp dip. Those issues limit how much strategic flexibility the company has and make the recovery path more sensitive to execution.

Overall, Myers appears stronger as an operational improvement and cash-flow recovery case than as a pure growth company. The recent rebound in share performance shows that the market is already recognizing part of that improvement. That leaves the company in an interesting but more exacting position: the business is improving, yet the valuation now calls for evidence that better margins, better cash flow, and debt reduction can continue rather than fade.

Sources:

  • Myers Industries, Inc. – Annual Report on Form 10-K for fiscal year 2025
  • Myers Industries, Inc. – Quarterly Report on Form 10-Q for quarter ended March 31, 2026
  • SEC EDGAR – Myers Industries, Inc. filings database
  • Myers Industries Investor Relations – earnings releases and investor presentation materials
  • Wikipedia – Myers Industries basic company background

This article is for informational purposes only and does not constitute financial advice. Some content is AI-generated. See Disclaimer


Sign up for exclusive research and insights.

Unsubscribe anytime.
