Stock Analysis · Marriott International Inc (MAR)
Overview
Marriott International is one of the world’s largest hotel companies. It operates an asset-light lodging model: rather than owning most of the buildings outright, it mainly manages hotels for owners and licenses brands to franchisees. That matters because it typically allows Marriott to expand with less capital tied up in real estate while collecting recurring fees tied to room revenue, hotel profitability, and loyalty activity.
The company’s brand portfolio spans luxury, premium, select-service, extended-stay, and midscale lodging, with well-known names such as Marriott Hotels, Ritz-Carlton, St. Regis, W, Westin, Sheraton, Courtyard, Residence Inn, Fairfield, and more recently the City Express brand in the affordable segment. Marriott also operates a major travel loyalty ecosystem through Marriott Bonvoy, which helps drive repeat stays and supports partnerships with credit card issuers and other travel businesses.
Its revenue mix is spread across hotel-related activities, but the broad economic engine is clearer than the accounting labels: Marriott earns high-value fees from managed and franchised hotels, while owned and leased properties contribute a smaller share and usually carry lower margins. Based on recent annual reporting, the main sources of revenue can be summarized as follows:
- Base management and franchise fees: approximately 35% to 45% — recurring fees paid by hotel owners and franchisees for operating under Marriott brands and systems.
- Incentive management fees: approximately 10% to 15% — performance-based fees linked to hotel profitability, making this line more sensitive to the travel cycle.
- Owned, leased, and other hotel revenue: approximately 30% to 40% — room, food, beverage, and property-level revenue from the smaller group of hotels Marriott still operates more directly.
- Loyalty, residential, and other revenue: approximately 10% to 20% — co-branded credit card and loyalty partnerships, residential branding and management, plus other ancillary business streams.
Over the past several years, total revenue has risen strongly from the pandemic recovery period into 2025, while operating income and net income have remained solid despite higher interest expense. The broad picture is a company with large scale, strong brands, and a business model designed to convert travel demand into fee income rather than heavy property ownership.
The financial flow also highlights an important feature of Marriott’s model: revenue has expanded materially since 2021, operating profit has grown, and selling and administrative costs have stayed relatively controlled compared with total sales. Interest expense has increased, but the company still converts a meaningful portion of revenue into profit and cash.
Key Figures
| Metric | Value | Sector ⓘ |
|---|---|---|
| Date | Sep 12, 2026 | |
| Context | ||
| Sector | Consumer Cyclical | |
| Industry | Lodging | |
| Market Cap ⓘ | $87.28B | |
| Beta ⓘ | 1.10 | |
Value (Cheapness) | ||
| P/E Ratio ⓘ | 34.01 | 17.10 |
| FCF Yield ⓘ | 3.59% | 8.53% |
| EBIT / EV ⓘ | 3.68% | 6.46% |
| PEG ⓘ | 1.65 | |
Growth (Business expansion) | ||
| Revenue Growth ⓘ | 11.10% | 5.75% |
| RPS Growth (5Y CAGR) ⓘ | 23.28% | 9.14% |
| EPS Growth (5Y CAGR) ⓘ | -3.52% | -18.21% |
| Margin Growth (5Y Trend) ⓘ | 4.45% | -0.23% |
| FCF Growth (5Y CAGR) ⓘ | 27.27% | 4.91% |
Quality (Business durability) | ||
| ROIC (Latest) ⓘ | 25.40% | 12.61% |
| ROIC (5Y Median) ⓘ | 25.60% | 10.72% |
| Net Debt / EBIT (Latest) ⓘ | 3.92 | 2.10 |
| Net Debt / EBIT (5Y Median) ⓘ | 3.86 | 2.32 |
| Operating Margin (Latest) ⓘ | 16.25% | 9.25% |
| Operating Margin (5Y Median) ⓘ | 16.00% | 9.64% |
| Debt to Equity (Latest) ⓘ | -392.80% | 75.78% |
| Profit Margin (Latest) ⓘ | 35.03% | 5.33% |
| Free Cash Flow (Latest) ⓘ | $3.13B | |
Momentum (Price trend) | ||
| 3Y Return ⓘ | +68.90% | +14.53% |
| 12M Return (excl. last month) ⓘ | +34.98% | +3.08% |
| 6M Return ⓘ | +6.24% | +0.55% |
| Price vs. 200-Day MA ⓘ | -2.82% | -0.54% |
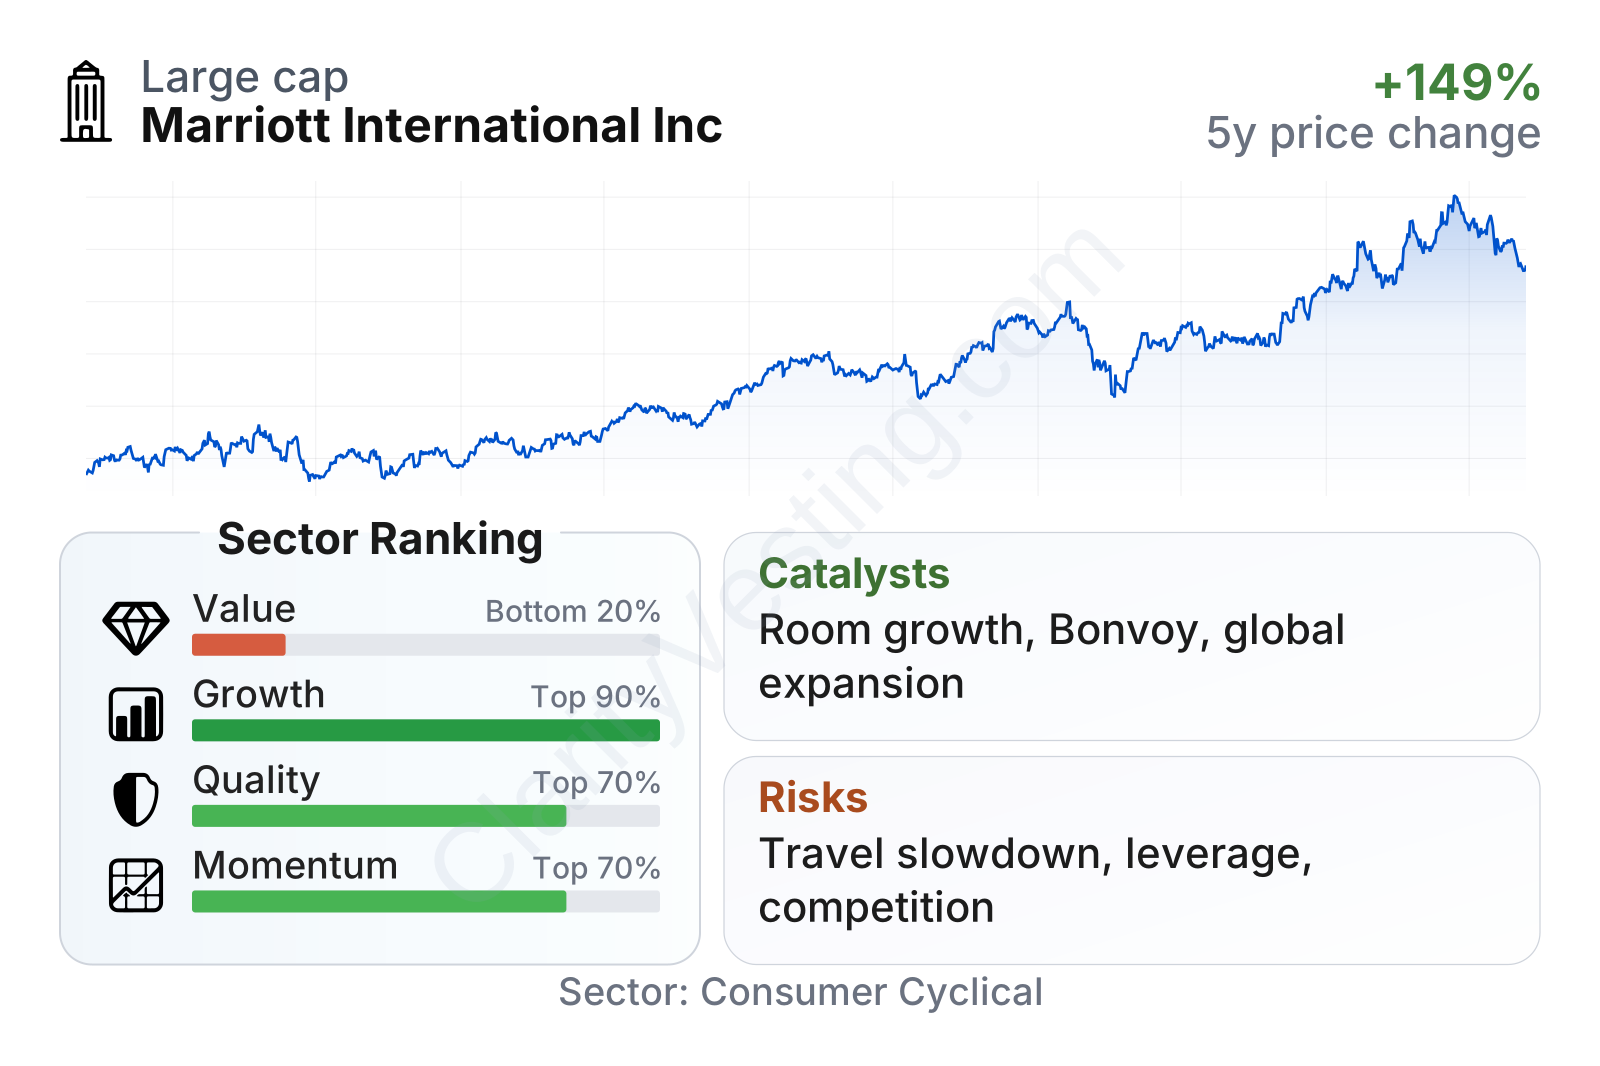
Marriott is a very large lodging company with stock volatility close to the broader market rather than extreme swings. The overall profile in the latest metrics is mixed but understandable: growth, quality, and market momentum rank well versus much of the sector, while valuation looks demanding. Profitability stands out, with returns on invested capital and operating margins clearly ahead of industry medians. At the same time, leverage-related measures are less comfortable, and the valuation multiples imply that the market is already recognizing much of Marriott’s business strength.
Growth
Marriott operates in a sector with durable long-term support: global travel demand tends to expand over time with rising incomes, urbanization, business travel, events, and international tourism. The hotel industry is cyclical in the short run, but the long-range direction has historically been upward, especially for companies with global brands and large development pipelines. Marriott is especially well positioned because its business model lets it add rooms through management and franchise agreements without having to fund most of the construction itself.
The company’s strategy for future growth is straightforward and logical. Marriott continues to expand its room count, deepen its presence internationally, add brands in underserved categories, and use Marriott Bonvoy to keep customers inside its ecosystem. That creates a flywheel: more properties make the loyalty program more attractive, and a stronger loyalty program makes Marriott more valuable to hotel owners choosing a brand partner.
Revenue growth has normalized from the extraordinary post-pandemic rebound, but it has remained positive. Recent year-over-year growth has generally been in the mid-single digits, and the latest trailing figure is still ahead of the sector median. That suggests Marriott is no longer benefiting from a one-time recovery surge, yet it is still growing faster than many peers through a combination of rate, unit expansion, and fee growth.
Cash generation is another important support for the growth case. Free cash flow moved from roughly $1.3 billion in early 2022 to just above $3.1 billion in the latest trailing period shown, despite some volatility along the way. For a hotel company that mostly grows through contracts rather than property ownership, strong cash conversion is a meaningful advantage because it provides flexibility for brand investment, technology spending, debt service, and shareholder returns.
Recent company updates have also pointed to continued development activity, international openings, and deeper penetration in newer segments such as affordable midscale and apartment-style accommodations. These are significant because they broaden Marriott’s addressable market beyond its traditional strength in upscale and business-oriented lodging. Another ongoing catalyst is loyalty monetization: Marriott Bonvoy remains a major platform for repeat demand and partner economics, particularly through co-branded card relationships and digital engagement.
Risks
This article is for informational purposes only and does not constitute financial advice. Some content is AI-generated. See Disclaimer


