Stock Ranking
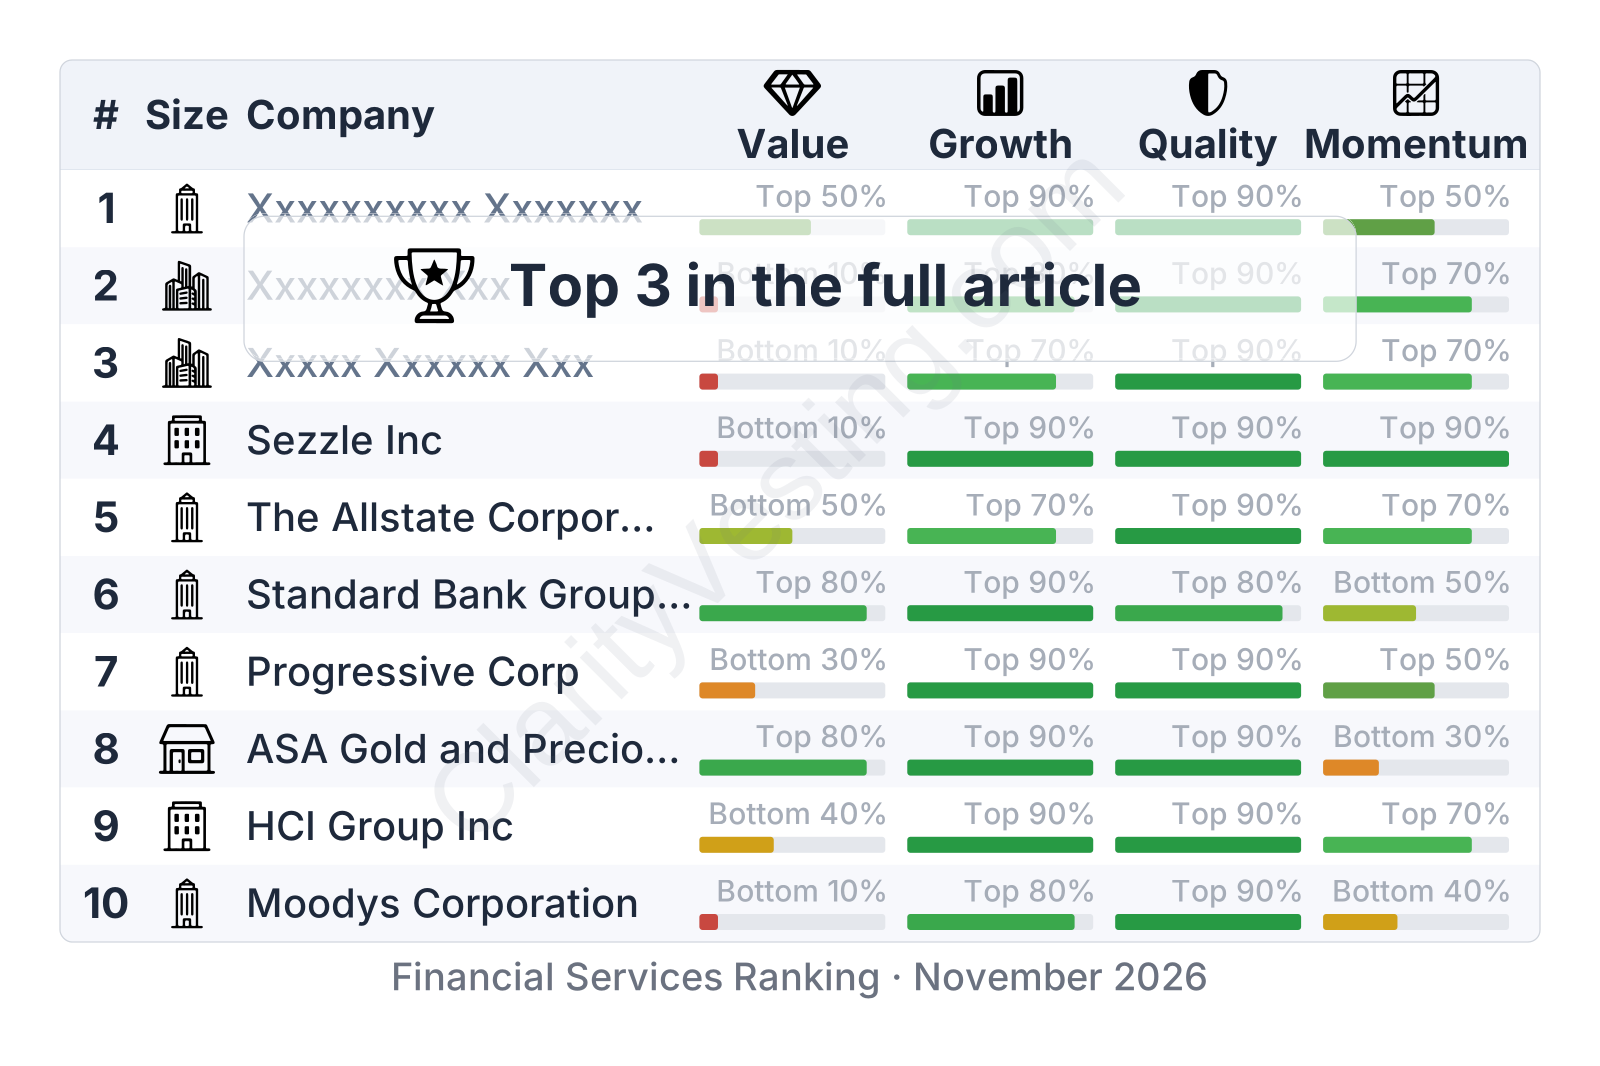
Financial Services Stock Ranking · November 2026
Published 01 Nov 2026
•
Updated 01 Nov 2026
This sector ranking is based on quantitative metrics grouped into four factors:
Value : measures how expensive a stock is relative to the company’s fundamentalsGrowth : measures how quickly the business is expandingQuality : assesses business durability, with a focus on debt levels, margins, and return on invested capitalMomentum : analyzes the current direction and strength of the stock price trendCompanies with strong fundamentals have historically delivered superior long-term performance. However, quantitative metrics alone are not sufficient to evaluate a business. Understanding how a company operates, along with its catalysts and risks, provides a more complete picture.
Quantitative rankings should be used as a starting point for research rather than as standalone investment decisions.
The ranking includes companies across different market capitalizations. Smaller-cap stocks may offer stronger growth opportunities but generally carry higher volatility and business risk.
CopyRight:SVG Design Editor;
configurationStart;Unit=smInches;Dpi=96;Division=4;Grid=True;Zoom=5;CanvasW=122.304;CanvasH=192;configurationEnd;
Large cap
Singapore Exchange Ltd
+156%
5y price change
CopyRight:SVG Design Editor;
configurationStart;Unit=smInches;Dpi=96;Division=4;Grid=True;Zoom=5;CanvasW=240;CanvasH=192;configurationEnd;
Value
Bottom 10%
CopyRight:SVG Design Editor;
configurationStart;Unit=smInches;Dpi=96;Division=4;Grid=True;Zoom=5;CanvasW=193.728;CanvasH=192;configurationEnd;
Growth
Top 60%
CopyRight:SVG Design Editor;
configurationStart;Unit=smInches;Dpi=96;Division=4;Grid=True;Zoom=5;CanvasW=160.128;CanvasH=192;configurationEnd;
Quality
Top 90%
CopyRight:SVG Design Editor;
configurationStart;Unit=smInches;Dpi=96;Division=4;Grid=True;Zoom=5;CanvasW=192.672;CanvasH=192;configurationEnd;
Momentum
Bottom 30%
Sector Ranking
Catalysts
Derivatives growth, data revenue,
Asia hub
Risks
Rich valuation, volume slowdown,
rivalry
Sector: Financial Services
ClarityVesting.com
Singapore Exchange operates Singapore’s core market infrastructure across equities, derivatives, clearing, and data. High margins, strong returns, and steady expansion beyond domestic stock trading make it a distinctive exchange operator.
Stock analysis Singapore Exchange Ltd
CopyRight:SVG Design Editor;
configurationStart;Unit=smInches;Dpi=96;Division=4;Grid=True;Zoom=5;CanvasW=180.864;CanvasH=192;configurationEnd;
Mid cap
Affiliated Managers Group Inc
+103%
5y price change
CopyRight:SVG Design Editor;
configurationStart;Unit=smInches;Dpi=96;Division=4;Grid=True;Zoom=5;CanvasW=240;CanvasH=192;configurationEnd;
Value
Bottom 20%
CopyRight:SVG Design Editor;
configurationStart;Unit=smInches;Dpi=96;Division=4;Grid=True;Zoom=5;CanvasW=193.728;CanvasH=192;configurationEnd;
Growth
Bottom 50%
CopyRight:SVG Design Editor;
configurationStart;Unit=smInches;Dpi=96;Division=4;Grid=True;Zoom=5;CanvasW=160.128;CanvasH=192;configurationEnd;
Quality
Top 90%
CopyRight:SVG Design Editor;
configurationStart;Unit=smInches;Dpi=96;Division=4;Grid=True;Zoom=5;CanvasW=192.672;CanvasH=192;configurationEnd;
Momentum
Top 80%
Sector Ranking
Catalysts
Alternatives expansion, affiliate
deals
Risks
Market-sensitive fees, affiliate
outflows
Sector: Financial Services
ClarityVesting.com
Affiliated Managers Group owns stakes in independent investment firms and has built a profitable niche around specialist active and alternative managers. Strong margins, high returns on capital, and improving earnings continue to support the appeal of its model.
Stock analysis Affiliated Managers Group Inc
CopyRight:SVG Design Editor;
configurationStart;Unit=smInches;Dpi=96;Division=4;Grid=True;Zoom=5;CanvasW=216.096;CanvasH=192;configurationEnd;
Small cap
Universal Insurance Holdings Inc
+296%
5y price change
CopyRight:SVG Design Editor;
configurationStart;Unit=smInches;Dpi=96;Division=4;Grid=True;Zoom=5;CanvasW=240;CanvasH=192;configurationEnd;
Value
Bottom 50%
CopyRight:SVG Design Editor;
configurationStart;Unit=smInches;Dpi=96;Division=4;Grid=True;Zoom=5;CanvasW=193.728;CanvasH=192;configurationEnd;
Growth
Top 70%
CopyRight:SVG Design Editor;
configurationStart;Unit=smInches;Dpi=96;Division=4;Grid=True;Zoom=5;CanvasW=160.128;CanvasH=192;configurationEnd;
Quality
Top 90%
CopyRight:SVG Design Editor;
configurationStart;Unit=smInches;Dpi=96;Division=4;Grid=True;Zoom=5;CanvasW=192.672;CanvasH=192;configurationEnd;
Momentum
Top 90%
Sector Ranking
Catalysts
Florida reforms, pricing, buybacks
Risks
Hurricanes, reinsurance, Florida
Sector: Financial Services
ClarityVesting.com
Universal Insurance Holdings is a homeowners-focused insurer that has rebuilt earnings, book value, and returns on capital after a difficult 2022. Sharper underwriting results and strong cash generation underscore the scale of its recent turnaround.
Stock analysis Universal Insurance Holdings Inc
CopyRight:SVG Design Editor;
configurationStart;Unit=smInches;Dpi=96;Division=4;Grid=True;Zoom=5;CanvasW=180.864;CanvasH=192;configurationEnd;
Mid cap
Acadian Asset Management Inc
+196%
5y price change
CopyRight:SVG Design Editor;
configurationStart;Unit=smInches;Dpi=96;Division=4;Grid=True;Zoom=5;CanvasW=240;CanvasH=192;configurationEnd;
Value
Bottom 10%
CopyRight:SVG Design Editor;
configurationStart;Unit=smInches;Dpi=96;Division=4;Grid=True;Zoom=5;CanvasW=193.728;CanvasH=192;configurationEnd;
Growth
Top 90%
CopyRight:SVG Design Editor;
configurationStart;Unit=smInches;Dpi=96;Division=4;Grid=True;Zoom=5;CanvasW=160.128;CanvasH=192;configurationEnd;
Quality
Top 90%
CopyRight:SVG Design Editor;
configurationStart;Unit=smInches;Dpi=96;Division=4;Grid=True;Zoom=5;CanvasW=192.672;CanvasH=192;configurationEnd;
Momentum
Top 90%
Sector Ranking
Catalysts
Institutional flows, quant demand,
margins
Risks
Market-linked fees, outflows, rich
valuation
Sector: Financial Services
ClarityVesting.com
Acadian Asset Management runs institutional portfolios through quantitative research and systematic strategies. Recent revenue growth, strong profitability, and rising earnings have drawn more attention, while its niche expertise gives it a distinct role in active asset management.
Stock analysis Acadian Asset Management Inc
CopyRight:SVG Design Editor;
configurationStart;Unit=smInches;Dpi=96;Division=4;Grid=True;Zoom=5;CanvasW=122.304;CanvasH=192;configurationEnd;
Large cap
Evercore Partners Inc
+108%
5y price change
CopyRight:SVG Design Editor;
configurationStart;Unit=smInches;Dpi=96;Division=4;Grid=True;Zoom=5;CanvasW=240;CanvasH=192;configurationEnd;
Value
Bottom 20%
CopyRight:SVG Design Editor;
configurationStart;Unit=smInches;Dpi=96;Division=4;Grid=True;Zoom=5;CanvasW=193.728;CanvasH=192;configurationEnd;
Growth
Top 80%
CopyRight:SVG Design Editor;
configurationStart;Unit=smInches;Dpi=96;Division=4;Grid=True;Zoom=5;CanvasW=160.128;CanvasH=192;configurationEnd;
Quality
Top 90%
CopyRight:SVG Design Editor;
configurationStart;Unit=smInches;Dpi=96;Division=4;Grid=True;Zoom=5;CanvasW=192.672;CanvasH=192;configurationEnd;
Momentum
Bottom 20%
Sector Ranking
Catalysts
M&A rebound, senior banker hires
Risks
Deal slowdown, talent retention
Sector: Financial Services
ClarityVesting.com
Evercore is a specialized advisory firm focused on high-value corporate transactions and supported by a smaller wealth management arm. Strong returns, a capital-light model, and a recovering earnings profile strengthen its long-term business case.
Stock analysis Evercore Partners Inc
CopyRight:SVG Design Editor;
configurationStart;Unit=smInches;Dpi=96;Division=4;Grid=True;Zoom=5;CanvasW=180.864;CanvasH=192;configurationEnd;
Mid cap
White Mountains Insurance Group Ltd
+107%
5y price change
CopyRight:SVG Design Editor;
configurationStart;Unit=smInches;Dpi=96;Division=4;Grid=True;Zoom=5;CanvasW=240;CanvasH=192;configurationEnd;
Value
Top 60%
CopyRight:SVG Design Editor;
configurationStart;Unit=smInches;Dpi=96;Division=4;Grid=True;Zoom=5;CanvasW=193.728;CanvasH=192;configurationEnd;
Growth
Top 80%
CopyRight:SVG Design Editor;
configurationStart;Unit=smInches;Dpi=96;Division=4;Grid=True;Zoom=5;CanvasW=160.128;CanvasH=192;configurationEnd;
Quality
Top 80%
CopyRight:SVG Design Editor;
configurationStart;Unit=smInches;Dpi=96;Division=4;Grid=True;Zoom=5;CanvasW=192.672;CanvasH=192;configurationEnd;
Momentum
Top 50%
Sector Ranking
Catalysts
Book value growth, specialty
pricing, BAM
Risks
Cat losses, volatile earnings,
complexity
Sector: Financial Services
ClarityVesting.com
White Mountains combines specialty insurance operations with a flexible capital-allocation model. Book value has compounded well over time, returns are currently strong, and leverage remains low, marking it as a notable example of long-term value creation in insurance.
Stock analysis White Mountains Insurance Group Ltd
CopyRight:SVG Design Editor;
configurationStart;Unit=smInches;Dpi=96;Division=4;Grid=True;Zoom=5;CanvasW=122.304;CanvasH=192;configurationEnd;
Large cap
The Travelers Companies Inc
+174%
5y price change
CopyRight:SVG Design Editor;
configurationStart;Unit=smInches;Dpi=96;Division=4;Grid=True;Zoom=5;CanvasW=240;CanvasH=192;configurationEnd;
Value
Bottom 30%
CopyRight:SVG Design Editor;
configurationStart;Unit=smInches;Dpi=96;Division=4;Grid=True;Zoom=5;CanvasW=193.728;CanvasH=192;configurationEnd;
Growth
Top 80%
CopyRight:SVG Design Editor;
configurationStart;Unit=smInches;Dpi=96;Division=4;Grid=True;Zoom=5;CanvasW=160.128;CanvasH=192;configurationEnd;
Quality
Top 80%
CopyRight:SVG Design Editor;
configurationStart;Unit=smInches;Dpi=96;Division=4;Grid=True;Zoom=5;CanvasW=192.672;CanvasH=192;configurationEnd;
Momentum
Top 80%
Sector Ranking
Catalysts
Commercial pricing, Higher
investment income
Risks
Cat losses, Claims inflation, Rich
P/B
Sector: Financial Services
ClarityVesting.com
Travelers is a major U.S. property and casualty insurer with a strong commercial franchise, rising earnings, improving book value, and returns well above many peers. The analysis focuses on the strength of its operating quality and why valuation has become more noteworthy.
Stock analysis The Travelers Companies Inc
CopyRight:SVG Design Editor;
configurationStart;Unit=smInches;Dpi=96;Division=4;Grid=True;Zoom=5;CanvasW=122.304;CanvasH=192;configurationEnd;
Large cap
Absa Group Ltd
+111%
5y price change
CopyRight:SVG Design Editor;
configurationStart;Unit=smInches;Dpi=96;Division=4;Grid=True;Zoom=5;CanvasW=240;CanvasH=192;configurationEnd;
Value
Top 90%
CopyRight:SVG Design Editor;
configurationStart;Unit=smInches;Dpi=96;Division=4;Grid=True;Zoom=5;CanvasW=193.728;CanvasH=192;configurationEnd;
Growth
Top 90%
CopyRight:SVG Design Editor;
configurationStart;Unit=smInches;Dpi=96;Division=4;Grid=True;Zoom=5;CanvasW=160.128;CanvasH=192;configurationEnd;
Quality
Top 80%
CopyRight:SVG Design Editor;
configurationStart;Unit=smInches;Dpi=96;Division=4;Grid=True;Zoom=5;CanvasW=192.672;CanvasH=192;configurationEnd;
Momentum
Top 50%
Sector Ranking
Catalysts
African banking growth, digital
rollout
Risks
South Africa weakness, credit
losses
Sector: Financial Services
ClarityVesting.com
Absa Group is a major African bank anchored in South Africa, combining broad retail and corporate banking operations with strong profitability and a very low valuation. Its blend of scale, dividends, and regional banking expansion gives the business added depth.
Stock analysis Absa Group Ltd
CopyRight:SVG Design Editor;
configurationStart;Unit=smInches;Dpi=96;Division=4;Grid=True;Zoom=5;CanvasW=122.304;CanvasH=192;configurationEnd;
Large cap
Computershare Ltd
+162%
5y price change
CopyRight:SVG Design Editor;
configurationStart;Unit=smInches;Dpi=96;Division=4;Grid=True;Zoom=5;CanvasW=240;CanvasH=192;configurationEnd;
Value
Bottom 10%
CopyRight:SVG Design Editor;
configurationStart;Unit=smInches;Dpi=96;Division=4;Grid=True;Zoom=5;CanvasW=193.728;CanvasH=192;configurationEnd;
Growth
Top 70%
CopyRight:SVG Design Editor;
configurationStart;Unit=smInches;Dpi=96;Division=4;Grid=True;Zoom=5;CanvasW=160.128;CanvasH=192;configurationEnd;
Quality
Top 90%
CopyRight:SVG Design Editor;
configurationStart;Unit=smInches;Dpi=96;Division=4;Grid=True;Zoom=5;CanvasW=192.672;CanvasH=192;configurationEnd;
Momentum
Top 80%
Sector Ranking
Catalysts
Higher client cash yields, Sticky
issuer base
Risks
Rate normalization, Operational
incidents
Sector: Financial Services
ClarityVesting.com
Computershare provides critical shareholder and equity-plan infrastructure for public companies around the world. In recent years, profits, cash flow, and returns have all strengthened, backed by scale, recurring client relationships, and a leading registry-services position.
Stock analysis Computershare Ltd
CopyRight:SVG Design Editor;
configurationStart;Unit=smInches;Dpi=96;Division=4;Grid=True;Zoom=5;CanvasW=122.304;CanvasH=192;configurationEnd;
Large cap
Renaissancere Holdings Ltd
+130%
5y price change
CopyRight:SVG Design Editor;
configurationStart;Unit=smInches;Dpi=96;Division=4;Grid=True;Zoom=5;CanvasW=240;CanvasH=192;configurationEnd;
Value
Bottom 30%
CopyRight:SVG Design Editor;
configurationStart;Unit=smInches;Dpi=96;Division=4;Grid=True;Zoom=5;CanvasW=193.728;CanvasH=192;configurationEnd;
Growth
Top 80%
CopyRight:SVG Design Editor;
configurationStart;Unit=smInches;Dpi=96;Division=4;Grid=True;Zoom=5;CanvasW=160.128;CanvasH=192;configurationEnd;
Quality
Top 90%
CopyRight:SVG Design Editor;
configurationStart;Unit=smInches;Dpi=96;Division=4;Grid=True;Zoom=5;CanvasW=192.672;CanvasH=192;configurationEnd;
Momentum
Top 60%
Sector Ranking
Catalysts
Firm reinsurance pricing, Higher
investment income
Risks
Catastrophe losses, Reserve
volatility
Sector: Financial Services
ClarityVesting.com
RenaissanceRe is a Bermuda-based reinsurer focused on catastrophe, property, casualty, and specialty risks. Recent results point to unusually strong profitability, disciplined underwriting, and low leverage, while its broader platform creates additional avenues for growth across insurance cycles.
Stock analysis Renaissancere Holdings Ltd
CopyRight:SVG Design Editor;
configurationStart;Unit=smInches;Dpi=96;Division=4;Grid=True;Zoom=5;CanvasW=122.304;CanvasH=192;configurationEnd;
Large cap
Moodys Corporation
+32%
5y price change
CopyRight:SVG Design Editor;
configurationStart;Unit=smInches;Dpi=96;Division=4;Grid=True;Zoom=5;CanvasW=240;CanvasH=192;configurationEnd;
Value
Bottom 10%
CopyRight:SVG Design Editor;
configurationStart;Unit=smInches;Dpi=96;Division=4;Grid=True;Zoom=5;CanvasW=193.728;CanvasH=192;configurationEnd;
Growth
Top 80%
CopyRight:SVG Design Editor;
configurationStart;Unit=smInches;Dpi=96;Division=4;Grid=True;Zoom=5;CanvasW=160.128;CanvasH=192;configurationEnd;
Quality
Top 90%
CopyRight:SVG Design Editor;
configurationStart;Unit=smInches;Dpi=96;Division=4;Grid=True;Zoom=5;CanvasW=192.672;CanvasH=192;configurationEnd;
Momentum
Bottom 50%
Sector Ranking
Catalysts
AI risk tools, issuance rebound,
Analytics mix
Risks
Issuance cyclicality, regulation,
rich valuation
Sector: Financial Services
ClarityVesting.com
Moody’s pairs a dominant credit ratings franchise with a larger analytics business that contributes recurring revenue. High margins, strong cash generation, and deep market entrenchment make it distinctive, while expanding risk and data tools reinforce its long-term relevance.
Stock analysis Moodys Corporation
CopyRight:SVG Design Editor;
configurationStart;Unit=smInches;Dpi=96;Division=4;Grid=True;Zoom=5;CanvasW=180.864;CanvasH=192;configurationEnd;
Mid cap
HCI Group Inc
+60%
5y price change
CopyRight:SVG Design Editor;
configurationStart;Unit=smInches;Dpi=96;Division=4;Grid=True;Zoom=5;CanvasW=240;CanvasH=192;configurationEnd;
Value
Bottom 40%
CopyRight:SVG Design Editor;
configurationStart;Unit=smInches;Dpi=96;Division=4;Grid=True;Zoom=5;CanvasW=193.728;CanvasH=192;configurationEnd;
Growth
Top 90%
CopyRight:SVG Design Editor;
configurationStart;Unit=smInches;Dpi=96;Division=4;Grid=True;Zoom=5;CanvasW=160.128;CanvasH=192;configurationEnd;
Quality
Top 90%
CopyRight:SVG Design Editor;
configurationStart;Unit=smInches;Dpi=96;Division=4;Grid=True;Zoom=5;CanvasW=192.672;CanvasH=192;configurationEnd;
Momentum
Top 70%
Sector Ranking
Catalysts
Florida depopulation, rate
strength, EPS surge
Risks
Florida storms, reinsurance costs,
concentration
Sector: Financial Services
ClarityVesting.com
HCI Group is a specialized homeowners insurer with a strong Florida presence. Recent years brought a sharp earnings rebound, fast book value growth, low leverage, and unusually high profitability, highlighting meaningful operating progress.
Stock analysis HCI Group Inc
CopyRight:SVG Design Editor;
configurationStart;Unit=smInches;Dpi=96;Division=4;Grid=True;Zoom=5;CanvasW=216.096;CanvasH=192;configurationEnd;
Small cap
ASA Gold and Precious Metals Ltd
+141%
5y price change
CopyRight:SVG Design Editor;
configurationStart;Unit=smInches;Dpi=96;Division=4;Grid=True;Zoom=5;CanvasW=240;CanvasH=192;configurationEnd;
Value
Top 80%
CopyRight:SVG Design Editor;
configurationStart;Unit=smInches;Dpi=96;Division=4;Grid=True;Zoom=5;CanvasW=193.728;CanvasH=192;configurationEnd;
Growth
Top 90%
CopyRight:SVG Design Editor;
configurationStart;Unit=smInches;Dpi=96;Division=4;Grid=True;Zoom=5;CanvasW=160.128;CanvasH=192;configurationEnd;
Quality
Top 90%
CopyRight:SVG Design Editor;
configurationStart;Unit=smInches;Dpi=96;Division=4;Grid=True;Zoom=5;CanvasW=192.672;CanvasH=192;configurationEnd;
Momentum
Bottom 20%
Sector Ranking
Catalysts
Gold rally, NAV growth, discount to
book
Risks
Gold slump, NAV discount, high
volatility
Sector: Financial Services
ClarityVesting.com
ASA Gold and Precious Metals provides listed exposure to a concentrated portfolio of mining and royalty companies. Recent gains in earnings and book value have been striking, and the shares still trade below book value, underscoring its asset backing and leverage to metals prices.
Stock analysis ASA Gold and Precious Metals Ltd
CopyRight:SVG Design Editor;
configurationStart;Unit=smInches;Dpi=96;Division=4;Grid=True;Zoom=5;CanvasW=122.304;CanvasH=192;configurationEnd;
Large cap
Progressive Corp
+173%
5y price change
CopyRight:SVG Design Editor;
configurationStart;Unit=smInches;Dpi=96;Division=4;Grid=True;Zoom=5;CanvasW=240;CanvasH=192;configurationEnd;
Value
Bottom 20%
CopyRight:SVG Design Editor;
configurationStart;Unit=smInches;Dpi=96;Division=4;Grid=True;Zoom=5;CanvasW=193.728;CanvasH=192;configurationEnd;
Growth
Top 90%
CopyRight:SVG Design Editor;
configurationStart;Unit=smInches;Dpi=96;Division=4;Grid=True;Zoom=5;CanvasW=160.128;CanvasH=192;configurationEnd;
Quality
Top 90%
CopyRight:SVG Design Editor;
configurationStart;Unit=smInches;Dpi=96;Division=4;Grid=True;Zoom=5;CanvasW=192.672;CanvasH=192;configurationEnd;
Momentum
Top 50%
Sector Ranking
Catalysts
Auto pricing discipline, higher
investment income
Risks
Claims inflation, catastrophes,
rate regulation
Sector: Financial Services
ClarityVesting.com
Progressive is a leading U.S. auto insurer that has combined scale with sharp pricing, disciplined underwriting, and rising book value. Earnings growth and capital efficiency are especially notable, helping explain the premium the market assigns to the franchise.
Stock analysis Progressive Corp
CopyRight:SVG Design Editor;
configurationStart;Unit=smInches;Dpi=96;Division=4;Grid=True;Zoom=5;CanvasW=122.304;CanvasH=192;configurationEnd;
Large cap
Standard Bank Group Ltd PK
+179%
5y price change
CopyRight:SVG Design Editor;
configurationStart;Unit=smInches;Dpi=96;Division=4;Grid=True;Zoom=5;CanvasW=240;CanvasH=192;configurationEnd;
Value
Top 80%
CopyRight:SVG Design Editor;
configurationStart;Unit=smInches;Dpi=96;Division=4;Grid=True;Zoom=5;CanvasW=193.728;CanvasH=192;configurationEnd;
Growth
Top 90%
CopyRight:SVG Design Editor;
configurationStart;Unit=smInches;Dpi=96;Division=4;Grid=True;Zoom=5;CanvasW=160.128;CanvasH=192;configurationEnd;
Quality
Top 80%
CopyRight:SVG Design Editor;
configurationStart;Unit=smInches;Dpi=96;Division=4;Grid=True;Zoom=5;CanvasW=192.672;CanvasH=192;configurationEnd;
Momentum
Bottom 40%
Sector Ranking
Catalysts
African trade, digital banking, CIB
scale
Risks
Currency swings, credit losses,
regulation
Sector: Financial Services
ClarityVesting.com
Standard Bank ranks among Africa’s largest banking groups, with operations spanning retail, corporate, markets, and insurance. Strong profitability, rising earnings, and a very low valuation relative to peers highlight its long-term position.
Stock analysis Standard Bank Group Ltd PK
CopyRight:SVG Design Editor;
configurationStart;Unit=smInches;Dpi=96;Division=4;Grid=True;Zoom=5;CanvasW=122.304;CanvasH=192;configurationEnd;
Large cap
The Allstate Corporation
+134%
5y price change
CopyRight:SVG Design Editor;
configurationStart;Unit=smInches;Dpi=96;Division=4;Grid=True;Zoom=5;CanvasW=240;CanvasH=192;configurationEnd;
Value
Bottom 50%
CopyRight:SVG Design Editor;
configurationStart;Unit=smInches;Dpi=96;Division=4;Grid=True;Zoom=5;CanvasW=193.728;CanvasH=192;configurationEnd;
Growth
Top 70%
CopyRight:SVG Design Editor;
configurationStart;Unit=smInches;Dpi=96;Division=4;Grid=True;Zoom=5;CanvasW=160.128;CanvasH=192;configurationEnd;
Quality
Top 90%
CopyRight:SVG Design Editor;
configurationStart;Unit=smInches;Dpi=96;Division=4;Grid=True;Zoom=5;CanvasW=192.672;CanvasH=192;configurationEnd;
Momentum
Top 70%
Sector Ranking
Catalysts
Rate increases, higher investment
income
Risks
Cat losses, claims inflation,
regulation
Sector: Financial Services
ClarityVesting.com
Allstate is a major U.S. personal-lines insurer centered on auto and homeowners coverage. Recent results show a sharp rebound in earnings, returns, and book value, supported by pricing actions, underwriting discipline, and stronger investment income.
Stock analysis The Allstate Corporation
CopyRight:SVG Design Editor;
configurationStart;Unit=smInches;Dpi=96;Division=4;Grid=True;Zoom=5;CanvasW=180.864;CanvasH=192;configurationEnd;
Mid cap
Sezzle Inc
+898%
5y price change
CopyRight:SVG Design Editor;
configurationStart;Unit=smInches;Dpi=96;Division=4;Grid=True;Zoom=5;CanvasW=240;CanvasH=192;configurationEnd;
Value
Bottom 10%
CopyRight:SVG Design Editor;
configurationStart;Unit=smInches;Dpi=96;Division=4;Grid=True;Zoom=5;CanvasW=193.728;CanvasH=192;configurationEnd;
Growth
Top 90%
CopyRight:SVG Design Editor;
configurationStart;Unit=smInches;Dpi=96;Division=4;Grid=True;Zoom=5;CanvasW=160.128;CanvasH=192;configurationEnd;
Quality
Top 90%
CopyRight:SVG Design Editor;
configurationStart;Unit=smInches;Dpi=96;Division=4;Grid=True;Zoom=5;CanvasW=192.672;CanvasH=192;configurationEnd;
Momentum
Top 90%
Sector Ranking
Catalysts
User growth, Sezzle Premium,
merchant gains
Risks
BNPL regulation, larger rivals,
volatility
Sector: Financial Services
ClarityVesting.com
Sezzle operates a fast-growing digital payments platform built around installment purchases. Revenue, margins, and cash generation have improved sharply, while newer engagement products and repeat-use trends are making the company a more prominent fintech name.
Stock analysis Sezzle Inc
This article is for informational purposes only and does not constitute financial advice. Some content is AI-generated. See Disclaimer