Stock Analysis · The Travelers Companies Inc (TRV)
Overview
The Travelers Companies Inc. is one of the largest property and casualty insurers in the United States. In simple terms, it sells insurance that helps businesses, government entities, organizations, and individuals recover from losses such as car accidents, home damage, workplace injuries, lawsuits, cyber incidents, and other unexpected events. The company also earns income by investing the premiums it collects before claims are paid, which is a core part of the insurance business model.
Travelers organizes its business into three main segments. Based on recent company reporting, the revenue mix is led by commercial insurance, followed by personal insurance, with bond and specialty insurance much smaller. Using 2025 segment revenue as a practical guide, the business mix is approximately:
- Business Insurance: about 57% — insurance for companies, including workers’ compensation, commercial auto, general liability, property, umbrella coverage, and various specialized commercial products.
- Personal Insurance: about 37% — mainly personal auto and homeowners insurance sold to individuals.
- Bond & Specialty Insurance: about 6% — surety, fidelity, management liability, cyber, professional liability, and related specialty lines.
That mix matters because it makes Travelers less dependent on one single market. Commercial insurance is the biggest earnings engine, while personal lines add scale and bond and specialty products provide niche exposure with attractive underwriting characteristics in certain years. Another important point for long-term readers is that reported revenue is not the whole economic picture for an insurer: underwriting profit and investment income are just as important as premium volume.
Over the last several years, the company’s overall revenue and profit pool have expanded, with especially strong improvement in 2024 and 2025. Claims costs remain the largest outflow, as expected for an insurer, but operating income and net income recovered sharply after a weaker 2022 period. That pattern suggests pricing discipline and improved underwriting conditions have recently mattered more than simple top-line growth.
Key Figures
| Metric | Value | Sector ⓘ |
|---|---|---|
| Date | Oct 20, 2026 | |
| Context | ||
| Sector | Financial Services | |
| Industry | Insurance - Property & Casualty | |
| Market Cap ⓘ | $80.40B | |
| Beta ⓘ | 0.44 | |
Value (Cheapness) | ||
| P/E Ratio ⓘ | 10.35 | 12.26 |
| P/B Ratio ⓘ | 2.80 | 1.23 |
| FCF Yield ⓘ | 13.28% | 10.33% |
| Dividend Yield ⓘ | 1.21% | 3.02% |
| EBIT / EV ⓘ | 15.34% | 8.14% |
| PEG ⓘ | 2.70 | |
Growth (Business expansion) | ||
| Revenue Growth ⓘ | -0.50% | 9.25% |
| RPS Growth (5Y CAGR) ⓘ | 11.50% | 12.19% |
| EPS Growth (5Y CAGR) ⓘ | 23.01% | -8.95% |
| BVPS Growth (5Y CAGR) ⓘ | 5.84% | 4.99% |
| Margin Growth (5Y Trend) ⓘ | 3.06% | -3.86% |
| FCF Growth (5Y CAGR) ⓘ | 9.88% | 4.81% |
| DPS Growth (5Y CAGR) ⓘ | 5.56% | 8.79% |
Quality (Business durability) | ||
| ROIC (Latest) ⓘ | 20.83% | 9.49% |
| ROE (Latest) ⓘ | 26.86% | 13.87% |
| ROA (Latest) ⓘ | 5.83% | 1.54% |
| ROIC (5Y Median) ⓘ | 10.96% | 7.86% |
| ROE (5Y Median) ⓘ | 12.78% | 12.17% |
| ROA (5Y Median) ⓘ | 3.09% | 1.30% |
| Net Debt / EBIT (Latest) ⓘ | 0.84 | 0.99 |
| Net Debt / EBIT (5Y Median) ⓘ | 1.36 | 0.73 |
| Net Debt / EBITDA (Latest) ⓘ | 0.79 | 0.91 |
| Operating Margin (Latest) ⓘ | 22.12% | 22.30% |
| Operating Margin (5Y Median) ⓘ | 13.78% | 24.63% |
| Debt to Equity (Latest) ⓘ | 33.84% | 58.32% |
| Profit Margin (Latest) ⓘ | 17.03% | 26.57% |
| Free Cash Flow (Latest) ⓘ | $10.68B | |
Momentum (Price trend) | ||
| 3Y Return ⓘ | +150.99% | +88.67% |
| 12M Return (excl. last month) ⓘ | +37.31% | +19.19% |
| 6M Return ⓘ | +29.11% | +4.70% |
| Price vs. 200-Day MA ⓘ | +19.42% | +3.66% |
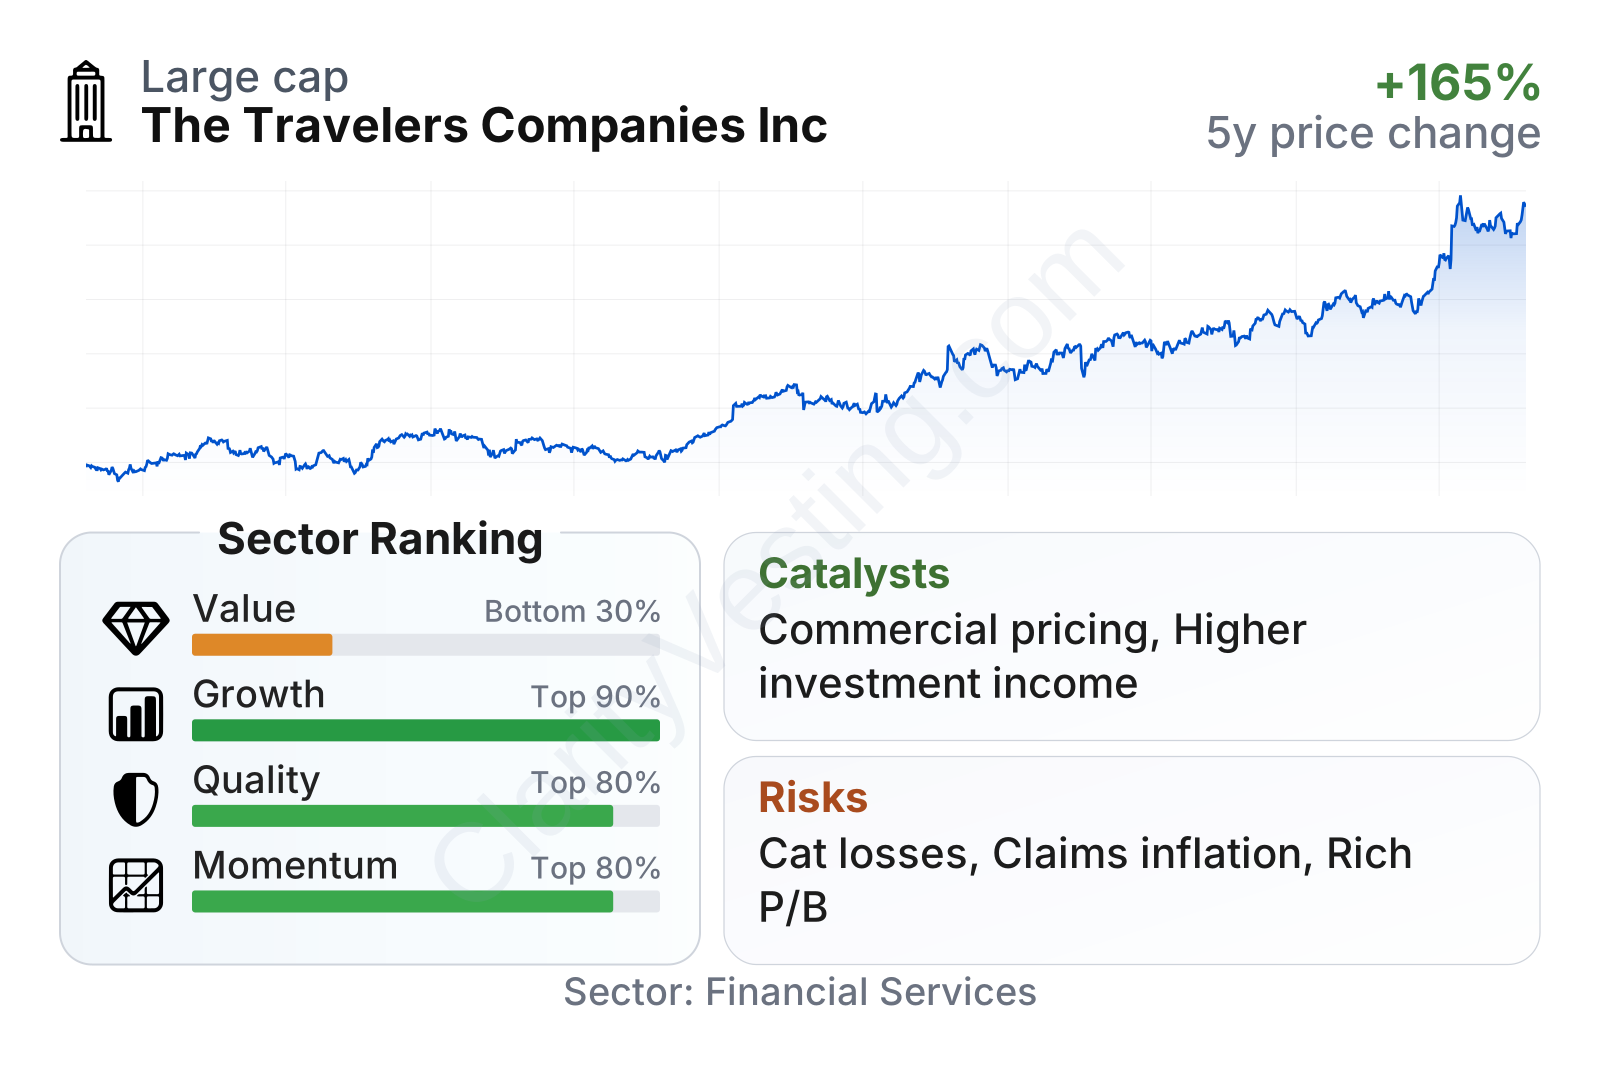
Travelers is a large insurer with a market value around $80 billion and a relatively low beta near 0.44, meaning its stock has historically moved less than the broader market. The quality and momentum profiles stand out versus much of the financial sector, while the value profile is mixed. The earnings multiple is below the sector median, but the price-to-book ratio is clearly above it, which shows the market is placing a premium on the company’s profitability and consistency rather than treating it as a bargain on asset value alone. Growth metrics are also stronger than they first appear: recent year-over-year revenue was flat to slightly down, yet five-year earnings growth, margin improvement, and cash generation compare very well with the sector.
The stock-price trend has also been unusually strong for an insurer. Over the last three years, Travelers has materially outperformed the sector median, and recent performance over six and twelve months has remained strong. At the same time, the dividend yield is modest at roughly 1%, which means the current shareholder return profile leans more toward earnings growth and price appreciation than income.
Growth
Property and casualty insurance is not a fast-growth industry in the way software or semiconductors can be, but it is a large and durable market tied to essential needs. Homes, cars, businesses, infrastructure projects, and liability exposures all need coverage. Over time, this creates a favorable backdrop for disciplined insurers that can price risk correctly and keep claims costs under control. Travelers operates in exactly that part of the market: mature, competitive, but structurally necessary.
Its strategy for growth is straightforward and sensible. Management has emphasized underwriting discipline, selective rate increases, distribution through agents and brokers, investment in data and analytics, and maintaining a broad mix across commercial, personal, and specialty lines. For insurers, growth is not only about writing more policies; it is about writing profitable policies. Travelers has recently shown that it can translate that discipline into better earnings.
The earnings trend illustrates this well. EPS dipped in 2022, recovered in 2023, then accelerated sharply in 2024 and 2025, with trailing results into 2026 remaining at a high level. That kind of progression usually points to a combination of stronger underwriting margins, favorable pricing, and solid investment income. Five-year EPS growth of about 23% annually is especially notable in an industry where many peers have had much more uneven results.
Book value per share also improved meaningfully after the decline seen in 2022. For insurers, book value is an important measure because it reflects the capital base supporting the business. Travelers’ book value per share climbed from about $90 at the end of 2022 to roughly $145 by the end of 2025, a strong recovery that aligns with improving profitability and capital generation.
There are also clear industry catalysts. Higher insurance pricing in commercial lines has supported premium quality, and elevated interest rates have generally helped insurers earn more on their investment portfolios as money is reinvested at better yields. In specialty areas such as cyber, management liability, and surety, Travelers has room to deepen penetration without needing transformational acquisitions. Recent company updates have also highlighted continued premium growth in several business lines and solid underlying underwriting performance, which supports the idea that current momentum is not driven by one unusual quarter alone.
Risks
This article is for informational purposes only and does not constitute financial advice. Some content is AI-generated. See Disclaimer


