Stock Analysis · Singapore Exchange Ltd (SPXCY)
Overview
Singapore Exchange Ltd, usually called SGX Group, operates the main securities and derivatives exchange infrastructure in Singapore. In simple terms, it runs marketplaces where shares, bonds, exchange-traded funds, currencies, commodities, and financial contracts can be traded, and it also provides the systems that clear and settle those transactions. That makes SGX more than just a stock exchange: it is a financial marketplace operator, a clearing house, and a provider of market data, indexes, and connectivity services.
The business model is attractive because exchanges can benefit from recurring activity, strong market positions, and high switching costs. Once market participants, brokers, and issuers are connected to an exchange and its clearing network, the system becomes deeply embedded in daily financial activity. SGX also has a strategic role as an Asian gateway for international investors who want exposure to regional equity, currency, freight, and commodity derivatives.
Based on the latest annual disclosures, SGX’s revenue mix is diversified across several areas rather than relying on a single product line. Approximate revenue sources can be summarized as follows:
- Derivatives trading and clearing: about 49%–50%. This is the largest contributor and includes equity index futures, currency futures, iron ore, freight, and other commodity-related contracts.
- Cash equities, fixed income, currencies and commodities, plus related clearing: about 27%–29%. This includes stock trading, securities clearing, depository services, bond-related activity, and over-the-counter foreign exchange and commodity services.
- Data, connectivity, and indexes: about 18%–20%. This includes market data subscriptions, index services, colocation, and network access used by financial institutions.
- Listings and issuer services: about 3%–5%. This includes listing fees from companies and structured products listed on SGX.
That mix matters for long-term analysis because it shows SGX is not only tied to stock market trading volumes. A large part of the group is linked to derivatives, clearing, and data services, which can be more resilient and often carry attractive margins.
The business has also shown a favorable earnings structure in recent years. Revenue has expanded steadily, while operating profit and net income have also trended upward. Margins remain high, reflecting the scalable economics typical of exchange operators.
Over the last several years, revenue has moved from roughly US$1.1 billion to about US$1.6 billion, while operating profit and net income also climbed materially. The overall picture is one of a business with strong operating leverage: once the platform and regulatory infrastructure are in place, additional volumes and services can translate into disproportionately strong profitability.
Key Figures
| Metric | Value | Sector ⓘ |
|---|---|---|
| Date | Oct 24, 2026 | |
| Context | ||
| Sector | Financial Services | |
| Industry | Financial Data & Stock Exchanges | |
| Market Cap ⓘ | $17.42B | |
| Beta ⓘ | 0.30 | |
Value (Cheapness) | ||
| P/E Ratio ⓘ | 32.21 | 12.46 |
| P/B Ratio ⓘ | 7.42 | 1.25 |
| FCF Yield ⓘ | 9.16% | 9.82% |
| Dividend Yield ⓘ | 2.07% | 2.94% |
| EBIT / EV ⓘ | N/A | 8.11% |
| PEG ⓘ | 2.67 | |
Growth (Business expansion) | ||
| Revenue Growth ⓘ | 19.60% | 9.10% |
| RPS Growth (5Y CAGR) ⓘ | 10.05% | 12.31% |
| EPS Growth (5Y CAGR) ⓘ | -0.80% | -6.97% |
| BVPS Growth (5Y CAGR) ⓘ | 11.94% | 5.02% |
| Margin Growth (5Y Trend) ⓘ | 6.56% | -4.00% |
| FCF Growth (5Y CAGR) ⓘ | 10.28% | 4.71% |
| DPS Growth (5Y CAGR) ⓘ | 8.90% | 8.92% |
Quality (Business durability) | ||
| ROIC (Latest) ⓘ | 47.50% | 9.18% |
| ROE (Latest) ⓘ | 61.50% | 13.93% |
| ROA (Latest) ⓘ | 31.56% | 1.57% |
| ROIC (5Y Median) ⓘ | 24.13% | 7.80% |
| ROE (5Y Median) ⓘ | 31.16% | 12.15% |
| ROA (5Y Median) ⓘ | 15.40% | 1.28% |
| Net Debt / EBIT (Latest) ⓘ | -0.68 | 1.02 |
| Net Debt / EBIT (5Y Median) ⓘ | -0.51 | 0.72 |
| Net Debt / EBITDA (Latest) ⓘ | -0.62 | 0.88 |
| Operating Margin (Latest) ⓘ | 56.25% | 22.30% |
| Operating Margin (5Y Median) ⓘ | 56.11% | 24.50% |
| Debt to Equity (Latest) ⓘ | 28.60% | 59.34% |
| Profit Margin (Latest) ⓘ | 44.79% | 26.42% |
| Free Cash Flow (Latest) ⓘ | $1.60B | |
Momentum (Price trend) | ||
| 3Y Return ⓘ | +155.70% | +95.73% |
| 12M Return (excl. last month) ⓘ | +39.36% | +17.30% |
| 6M Return ⓘ | -3.88% | +6.07% |
| Price vs. 200-Day MA ⓘ | -2.60% | +5.36% |
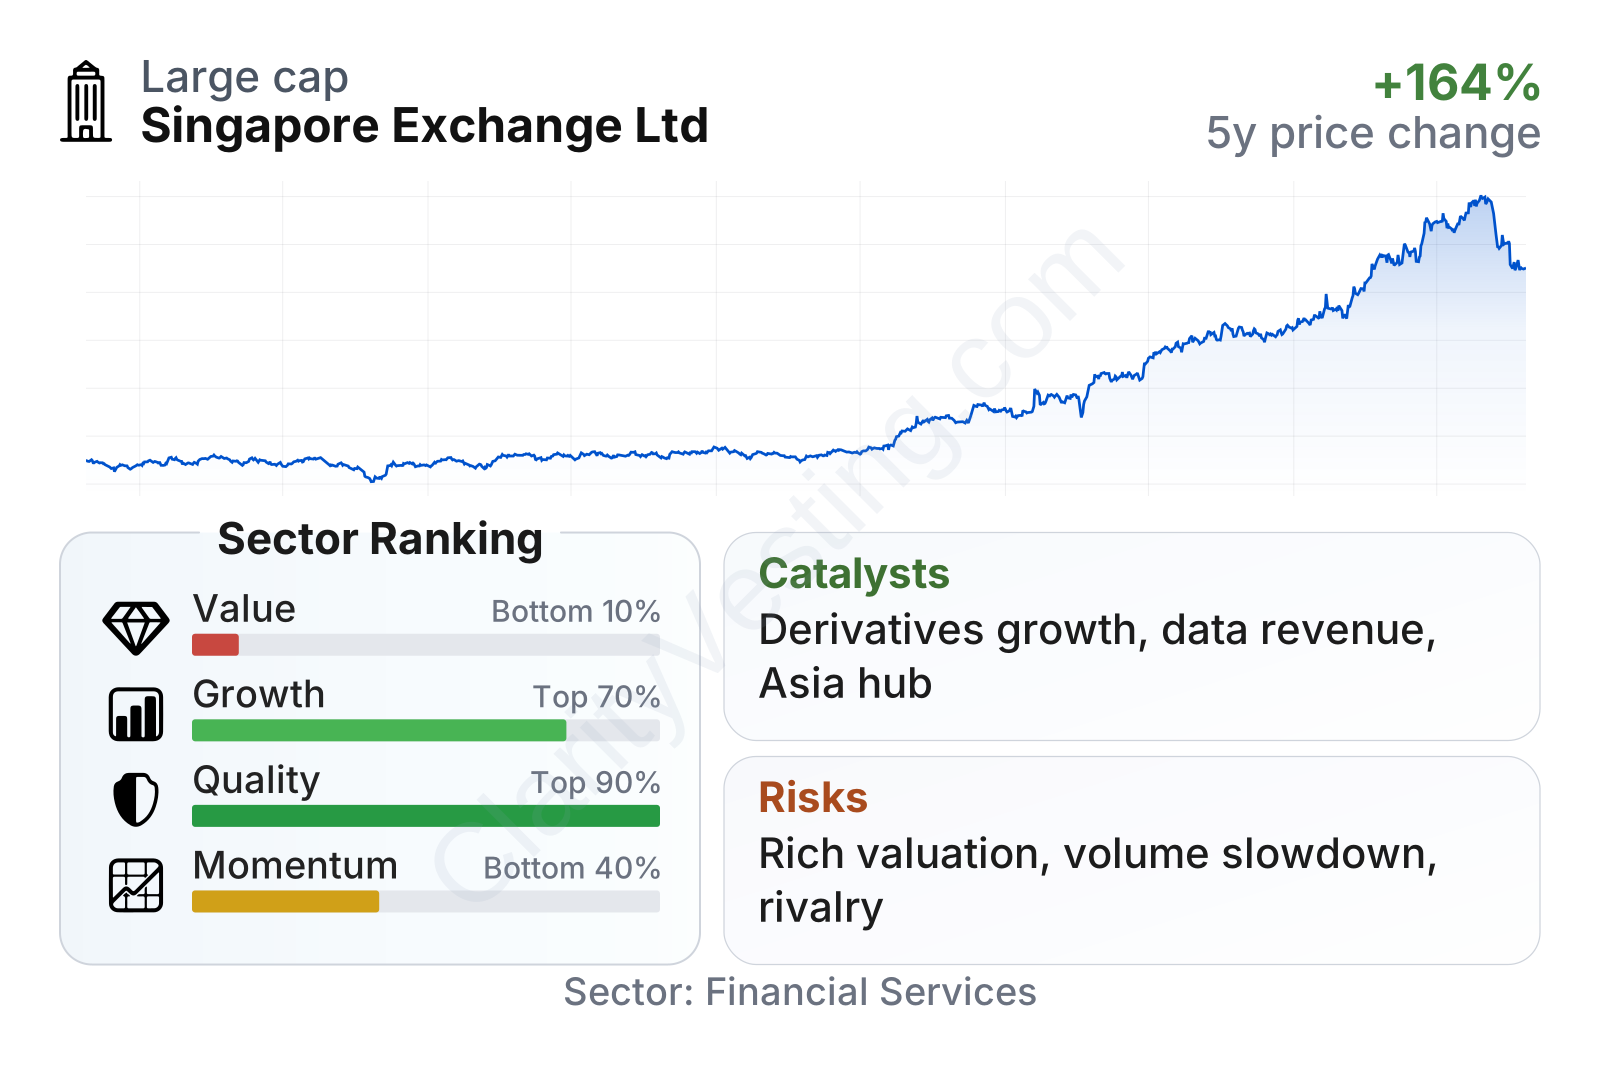
SGX stands out for quality and financial strength more than for traditional cheapness. Profitability ratios are far above sector norms, with very high returns on capital, equity, and assets, and margins that are unusually strong for financial services. Balance sheet risk looks limited as well, with modest leverage and net cash-like characteristics rather than heavy debt dependence. Growth indicators are respectable, especially in recent revenue and cash flow expansion, while market performance has also been strong over the last one to three years. The weaker area is valuation: earnings and book-value multiples are well above sector medians, so the market is already recognizing these strengths.
Growth
SGX operates in a part of finance that still has long-term growth drivers. Global capital markets continue to deepen, derivatives usage keeps expanding, and demand for risk management tools remains supported by volatility in interest rates, currencies, shipping, and commodities. Asia is also an important structural theme. As regional capital markets mature and global institutions look for Asian exposures, exchanges with cross-border relevance can benefit from greater trading, clearing, and data demand.
SGX’s strategy appears broadly coherent for that environment. Management has spent years moving the company beyond a domestic stock exchange model and toward a broader multi-asset platform. The emphasis on derivatives, commodities, currencies, and data services is important because these activities generally have better growth potential and can be less dependent on the pace of new stock listings. The company has also built a stronger role in products tied to international benchmarks and Asian risk management.
Earnings growth has not been perfectly smooth in every reporting period, but the broader trend in profit generation remains positive. Revenue growth has recently been stronger than the sector median, and operating margins have improved over the last five years rather than deteriorated. That combination suggests SGX is not just growing by adding volume; it is also preserving pricing power and operating discipline.
Book value per share has risen steadily over the last five years, which supports the view that SGX has been compounding shareholder equity while maintaining high returns. That is notable because some mature exchange businesses can become cash-generative but stagnant. Here, the pattern still points to underlying business expansion rather than mere financial engineering.
A significant catalyst is SGX’s continued push into international derivatives and over-the-counter clearing-related services. These markets benefit from growing hedging needs in freight, iron ore, foreign exchange, and broader cross-asset risk management. Another supportive factor is the increasing value of recurring data and index revenue. As more institutions rely on benchmark products and real-time market access, these fees can add stability alongside trading-linked income.
Recent corporate updates have also highlighted continued investment in technology, products, and partnerships aimed at strengthening SGX’s role as an international marketplace rather than only a Singapore-focused venue. That does not guarantee rapid expansion every year, but it does fit a credible long-term growth path.
Risks
This article is for informational purposes only and does not constitute financial advice. Some content is AI-generated. See Disclaimer


