Stock Analysis · Innovent Biologics Inc (IVBXF)
Overview
Innovent Biologics is a Chinese biotechnology company focused on discovering, developing, manufacturing, and commercializing biologic medicines. In simple terms, it makes complex drugs, especially antibody-based treatments, used in areas such as cancer, cardiovascular disease, autoimmune disorders, ophthalmology, and metabolic disease. The company has gradually evolved from a research-heavy biotech into a broader commercial-stage business with a growing marketed product base and a larger manufacturing footprint.
Its revenue comes from a mix of product sales and collaboration-related income. The exact mix can move noticeably from year to year because milestone payments and licensing deals are not always recurring, but recent annual reporting shows product revenue has become the dominant driver.
- Product sales: approximately 75% to 85% of recent revenue. This mainly includes commercialized medicines sold in China, especially oncology products, as well as newer contributions from other therapeutic areas.
- License fee revenue: approximately 10% to 20%. This includes upfront payments, milestone income, and other consideration from partnerships with larger pharmaceutical companies.
- Research and development service revenue and other income: generally a small single-digit to low-teens percentage, depending on the year. This can include co-development services or other partnership-related activities.
A notable business shift is visible over the last several years: revenue has expanded sharply, gross profit has improved meaningfully, and the company moved from heavy operating losses to operating profitability in 2025. Research spending remains high, which is typical for a biotech with a broad pipeline, but it is now being supported by a much larger commercial base.
The financial flow highlights a major improvement in business scale. Revenue and gross profit rose strongly between 2021 and 2025, while losses narrowed and then turned into positive operating income and net income in 2025. The biggest watch item is operating expense mix: research spending stayed elevated, but selling and administrative costs also became much larger, showing that commercialization is becoming more important and more expensive at the same time.
Key Figures
| Metric | Value | Sector ⓘ |
|---|---|---|
| Date | Oct 23, 2026 | |
| Context | ||
| Sector | Healthcare | |
| Industry | Biotechnology | |
| Market Cap ⓘ | $21.30B | |
| Beta ⓘ | 0.33 | |
Value (Cheapness) | ||
| P/E Ratio ⓘ | 135.71 | 25.42 |
| P/B Ratio ⓘ | 1.01 | 3.08 |
| FCF Yield ⓘ | 67.84% | 3.12% |
| Dividend Yield ⓘ | N/A | 1.85% |
| EBIT / EV ⓘ | N/A | 0.56% |
| PEG ⓘ | 0.92 | |
Growth (Business expansion) | ||
| Revenue Growth ⓘ | 44.80% | 7.50% |
| RPS Growth (5Y CAGR) ⓘ | 25.59% | 8.60% |
| EPS Growth (5Y CAGR) ⓘ | -54.35% | -17.73% |
| BVPS Growth (5Y CAGR) ⓘ | 11.89% | 3.72% |
| Margin Growth (5Y Trend) ⓘ | N/A | -0.57% |
| FCF Growth (5Y CAGR) ⓘ | N/A | 0.96% |
| DPS Growth (5Y CAGR) ⓘ | N/A | 6.69% |
Quality (Business durability) | ||
| ROIC (Latest) ⓘ | N/A | 3.17% |
| ROA (Latest) ⓘ | 7.43% | 2.98% |
| ROIC (5Y Median) ⓘ | -5.46% | 4.56% |
| ROA (5Y Median) ⓘ | -5.38% | 1.87% |
| Net Debt / EBIT (Latest) ⓘ | -4.94 | 1.34 |
| Net Debt / EBIT (5Y Median) ⓘ | N/A | 1.86 |
| Net Debt / EBITDA (Latest) ⓘ | -3.59 | 1.00 |
| Net Debt / Assets ⓘ | -36.18% | 5.06% |
| EBITDA / Interest ⓘ | N/A | 9.55 |
| Operating Margin (Latest) ⓘ | 11.33% | 9.25% |
| Operating Margin (5Y Median) ⓘ | -16.85% | 7.33% |
| Debt to Equity (Latest) ⓘ | 11.20% | 26.68% |
| Profit Margin (Latest) ⓘ | 7.85% | 3.34% |
| Free Cash Flow (Latest) ⓘ | $14.45B | |
Momentum (Price trend) | ||
| 3Y Return ⓘ | +112.45% | +51.61% |
| 12M Return (excl. last month) ⓘ | +14.00% | +19.90% |
| 6M Return ⓘ | +12.73% | +10.10% |
| Price vs. 200-Day MA ⓘ | +3.29% | +6.44% |
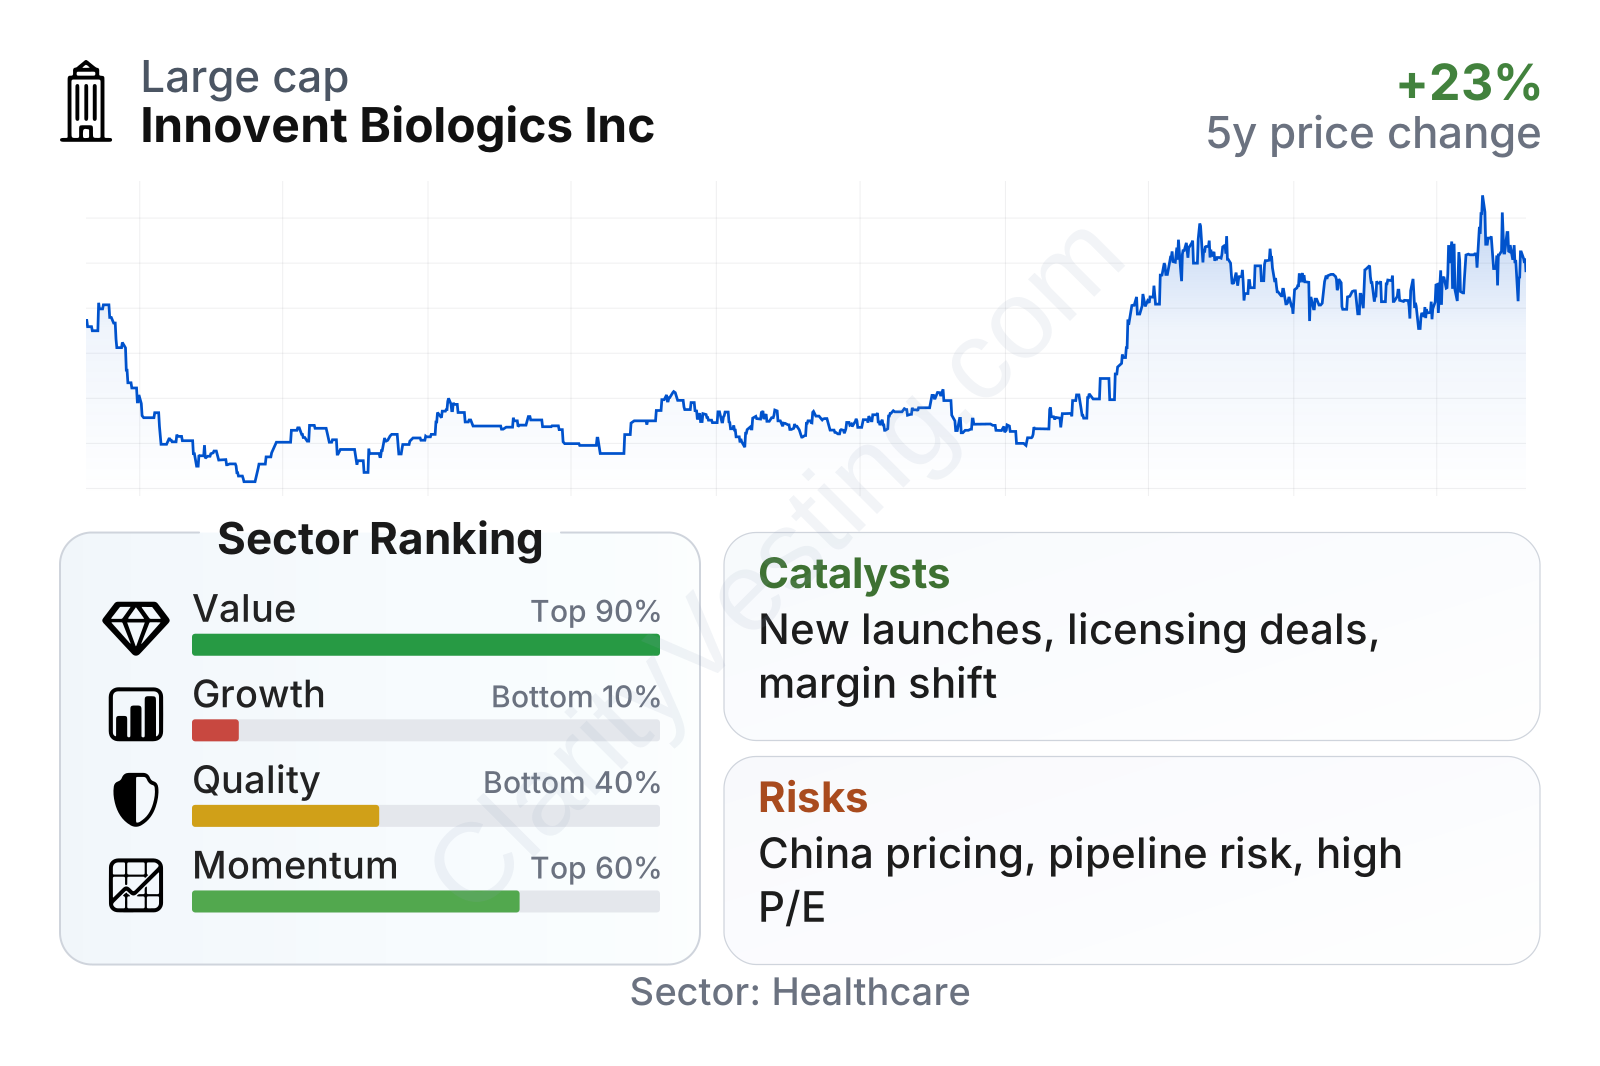
The recent metric profile is unusual in a good way for a biotech: fast revenue growth, positive margins, low balance-sheet strain, and substantial cash generation. The company’s debt burden looks modest, and net cash appears to be a real strength rather than a technical detail. At the same time, the table also shows why the stock can be harder to judge. Earnings-based valuation looks rich, but book value and PEG look much more moderate, suggesting the market is pricing in continued expansion rather than mature, stable profits. Growth remains strong on a revenue basis, yet the broader growth ranking is held back by weak long-term earnings history, which reflects how recently Innovent crossed into profitability.
The share-price chart shows a volatile path rather than a smooth compounding trend. After a steep decline from 2021 into 2022, the stock recovered in waves and moved sharply higher through 2025 and into 2026. That pattern fits a company whose market value is closely tied to pipeline progress, licensing outcomes, and confidence that commercialization is becoming durable.
Growth
Innovent operates in one of the more attractive parts of healthcare for long-term expansion. Biologics, oncology drugs, autoimmune therapies, and metabolic treatments all benefit from rising demand, longer treatment duration, and continued innovation. In China, the long-term opportunity is especially large because domestic biotech companies are trying to build stronger positions in advanced medicines that were once dominated by multinational drugmakers.
The company’s strategy makes sense for future growth because it is not relying on a single product. It has built a portfolio across several disease areas, while also using partnerships to extend global reach and reduce some development risk. That combination matters. A biotech with one blockbuster can grow quickly but also fall quickly; a biotech with multiple marketed products, internal manufacturing, and external alliances has a more diversified base.
One of the strongest catalysts is the transition from pipeline promise to commercial proof. Innovent has already shown it can turn R&D into approved products and revenue. Another catalyst is the expanding role of licensing and co-development deals. These arrangements can bring in non-dilutive cash, validate the science externally, and help the company access markets beyond China. The company’s move into metabolic disease and other large-addressable categories may also become important if clinical and commercial execution continues to improve.
Recent operating performance itself is a catalyst. Revenue growth around the mid-40% range year over year is far above the sector median, and margins have moved from negative territory to positive levels. That matters because it changes the market debate from “can the company scale?” to “how durable is the new level of profitability?” For a biotech, that is a significant change in profile.
Another positive sign is financial flexibility. With a relatively strong balance sheet and net cash position, Innovent appears better equipped than many biotech peers to fund trials, launch products, and absorb setbacks without immediate financing pressure. In an industry where capital access often shapes outcomes, that is a meaningful growth support.
Risks
This article is for informational purposes only and does not constitute financial advice. Some content is AI-generated. See Disclaimer