Stock Analysis · RLI Corp (RLI)
Overview
RLI Corp is a specialty property and casualty insurer. In simple terms, it provides insurance for risks that are often more complex, unusual, or narrowly defined than standard personal auto or homeowners policies. The company focuses on selected niches where underwriting discipline matters more than sheer size. It also earns income by investing the premiums it holds before claims are paid, which is a core part of the insurance business model.
Its business is organized mainly across casualty, property, and surety insurance. Based on recent annual reporting, revenue is driven primarily by net earned premiums, with a smaller but still meaningful contribution from investment income and a limited contribution from other underwriting-related items and realized gains or losses that can move around from year to year.
The main sources of revenue are approximately:
- Net earned premiums: about 80% to 85% of total revenue. This is the core insurance revenue and includes products across casualty lines, property coverage, and surety bonds.
- Net investment income: about 10% to 15% of total revenue. Insurers invest their float, usually in bonds and other income-producing securities, and this has become more helpful as interest rates have stayed above the very low levels of prior years.
- Other items: about 0% to 5% in most years. This can include fee income, realized investment gains or losses, and other operating items that are less stable than premiums.
Within underwriting, RLI’s mix typically leans most heavily toward casualty, followed by surety and property, although the exact contribution can shift with market conditions, pricing, catastrophe losses, and the pace of bond activity. Casualty includes various liability-related specialty lines, property covers commercial risks exposed to weather and catastrophe events, and surety provides bonds that guarantee performance or payment obligations.
What stands out operationally is that the business has grown total revenue from roughly $1.2 billion in 2021 to about $1.9 billion in 2025, while maintaining relatively high profitability for the sector. That combination usually signals a disciplined insurer rather than one chasing volume at any price.
The long-term picture shows a business with expanding revenue and net income after a volatile 2023, followed by recovery in 2024 and further improvement in 2025. Profitability has remained solid despite the normal ups and downs that come with insurance claims and investment markets.
Key Figures
| Metric | Value | Sector ⓘ |
|---|---|---|
| Date | Oct 23, 2026 | |
| Context | ||
| Sector | Financial Services | |
| Industry | Insurance - Property & Casualty | |
| Market Cap ⓘ | $6.15B | |
| Beta ⓘ | 0.32 | |
Value (Cheapness) | ||
| P/E Ratio ⓘ | 14.92 | 12.46 |
| P/B Ratio ⓘ | 3.64 | 1.25 |
| FCF Yield ⓘ | 8.74% | 9.82% |
| Dividend Yield ⓘ | 1.06% | 2.94% |
| EBIT / EV ⓘ | 10.38% | 8.11% |
| PEG ⓘ | 1.73 | |
Growth (Business expansion) | ||
| Revenue Growth ⓘ | -6.30% | 9.10% |
| RPS Growth (5Y CAGR) ⓘ | -5.77% | 12.31% |
| EPS Growth (5Y CAGR) ⓘ | 0.32% | -6.97% |
| BVPS Growth (5Y CAGR) ⓘ | -7.98% | 5.02% |
| Margin Growth (5Y Trend) ⓘ | -1.99% | -4.00% |
| FCF Growth (5Y CAGR) ⓘ | 12.75% | 4.71% |
| DPS Growth (5Y CAGR) ⓘ | -3.01% | 8.92% |
Quality (Business durability) | ||
| ROIC (Latest) ⓘ | 22.63% | 9.18% |
| ROE (Latest) ⓘ | 22.74% | 13.93% |
| ROA (Latest) ⓘ | 6.27% | 1.57% |
| ROIC (5Y Median) ⓘ | 36.24% | 7.80% |
| ROE (5Y Median) ⓘ | 23.62% | 12.15% |
| ROA (5Y Median) ⓘ | 6.61% | 1.28% |
| Net Debt / EBIT (Latest) ⓘ | 0.47 | 1.02 |
| Net Debt / EBIT (5Y Median) ⓘ | 0.31 | 0.72 |
| Net Debt / EBITDA (Latest) ⓘ | 0.48 | 0.88 |
| Operating Margin (Latest) ⓘ | 28.83% | 22.30% |
| Operating Margin (5Y Median) ⓘ | 27.75% | 24.50% |
| Debt to Equity (Latest) ⓘ | 17.51% | 59.34% |
| Profit Margin (Latest) ⓘ | 20.34% | 26.42% |
| Free Cash Flow (Latest) ⓘ | $537.69M | |
Momentum (Price trend) | ||
| 3Y Return ⓘ | +8.82% | +95.73% |
| 12M Return (excl. last month) ⓘ | -9.39% | +17.30% |
| 6M Return ⓘ | +18.08% | +6.07% |
| Price vs. 200-Day MA ⓘ | +15.15% | +5.36% |
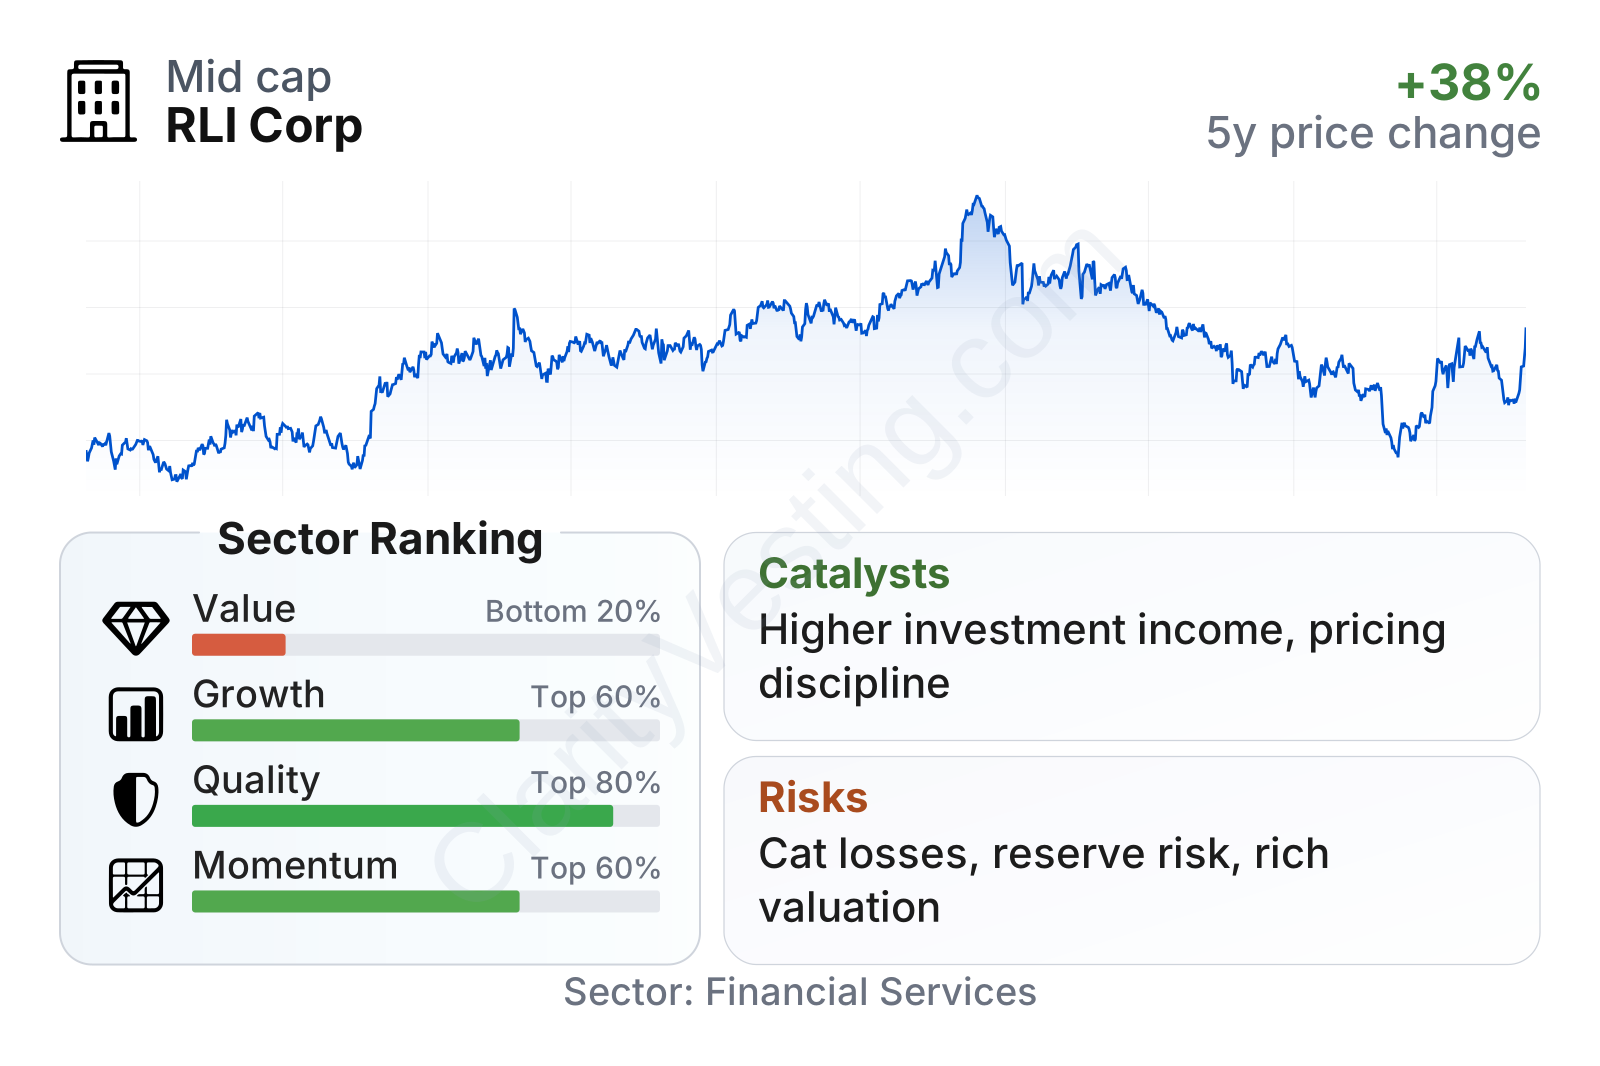
RLI is a mid-sized insurer with an unusually low beta of about 0.3, meaning its stock has historically moved much less than the broader market. Profitability and balance-sheet quality look strong relative to the sector, with returns on equity and assets clearly above peer medians and leverage well below typical industry levels. On the other hand, the valuation profile is not cheap on traditional measures, especially price-to-book, and recent revenue growth has been softer than the sector median. Price performance has also been mixed: weaker over the past year before a rebound in recent months.
Growth
RLI operates in specialty property and casualty insurance, a segment that generally benefits from steady long-term demand. Businesses still need liability coverage, property protection, and surety bonds regardless of the economic cycle, and more complex risks often support better pricing than commoditized insurance markets. That creates a favorable backdrop for disciplined underwriters, especially when the industry is in a so-called hard market, where insurers can raise prices and tighten terms after periods of elevated claims.
The company’s strategy also makes sense for long-term expansion. Rather than competing mainly on scale, RLI emphasizes underwriting selection, niche expertise, and decentralized product knowledge. In insurance, that can be a durable model because poor pricing eventually shows up in claims, while careful pricing can support attractive returns over time. RLI’s strong return metrics suggest that this approach has worked better than average.
Earnings per share have trended higher over the last several years, moving from under $2 in 2021 to above $3.5 in 2025, although quarterly insurance results can be uneven because catastrophe losses, reserve development, and investment marks do not arrive smoothly. Even with that normal volatility, the direction has been positive.
Book value per share is especially important for insurers because it reflects the capital base supporting underwriting. RLI’s book value dropped sharply in 2022, largely in a period when fixed-income portfolios across the industry were pressured by interest-rate moves, then recovered over the following years. That rebound matters because it shows the balance sheet rebuilt while earnings remained solid.
A meaningful catalyst is the interest-rate environment. Higher reinvestment yields can lift investment income as maturing bonds are replaced at better rates. For an insurer with steady underwriting profitability, that can support overall earnings even if premium growth is not rapid. Another catalyst is continued favorable pricing in specialty lines, where underwriting discipline can allow premium increases without relying on aggressive expansion.
Recent company reporting has also highlighted ongoing premium growth in selected business lines and continued confidence in underwriting opportunities. For a specialty insurer, that matters more than raw size because profitable growth depends on staying selective rather than writing every available policy.
Risks
This article is for informational purposes only and does not constitute financial advice. Some content is AI-generated. See Disclaimer