Stock Analysis · Renaissancere Holdings Ltd (RNR)
Overview
RenaissanceRe Holdings Ltd is a global reinsurer and insurer. In simple terms, it helps other insurance companies absorb very large risks, especially risks tied to natural catastrophes such as hurricanes, earthquakes, wildfires, and severe storms. It also writes specialty insurance and reinsurance for areas such as casualty, professional lines, and other complex commercial risks. The company is based in Bermuda and is known for using data, modeling, and disciplined pricing to decide which risks it wants to take.
Its business is mainly organized around two large segments: Property and Casualty & Specialty. Property includes catastrophe reinsurance and other property-related covers, while Casualty & Specialty includes casualty and specialty reinsurance plus insurance operations. Based on the company’s recent annual reporting, revenue is still weighted toward property-focused business, but the mix has become more balanced after acquisitions and expansion in specialty lines.
The main revenue sources can be summarized as follows:
- Property reinsurance and insurance: approximately 55% to 65%. This includes catastrophe reinsurance, other property reinsurance, and insurance products exposed to weather and disaster-related risks.
- Casualty and specialty reinsurance: approximately 25% to 35%. This includes liability-related reinsurance, credit, surety, workers’ compensation, and other specialty products.
- Insurance and fee-related activities within specialty platforms: approximately 5% to 15%. This includes primary insurance operations and certain managed or structured activities.
- Net investment income and other items: meaningful but variable. Like most insurers, RenaissanceRe also earns income by investing the premium float before claims are paid.
One important point for long-term readers: reinsurance results can look unusually volatile from one year to the next because a single severe catastrophe season can sharply change profits. That does not necessarily mean the business model is broken; it is part of the industry. What matters more is whether the company is underwriting profitably through the cycle, preserving capital, and expanding book value over time. In recent years, the business has also become larger and more diversified, which can help reduce dependence on any single event or line of business.
The overall earnings profile has improved markedly since 2022. Revenue and operating profit recovered strongly in 2023 and remained high through 2025, showing the benefit of firmer reinsurance pricing and stronger underwriting conditions. The business still carries event risk, but recent years suggest much better profitability than the loss-heavy period seen earlier in the cycle.
Key Figures
| Metric | Value | Sector ⓘ |
|---|---|---|
| Date | Nov 01, 2026 | |
| Context | ||
| Sector | Financial Services | |
| Industry | Insurance - Reinsurance | |
| Market Cap ⓘ | $13.71B | |
| Beta ⓘ | 0.12 | |
Value (Cheapness) | ||
| P/E Ratio ⓘ | 9.71 | 12.20 |
| P/B Ratio ⓘ | 3.49 | 1.26 |
| FCF Yield ⓘ | 20.55% | 9.87% |
| Dividend Yield ⓘ | 0.48% | 2.87% |
| EBIT / EV ⓘ | 19.27% | 8.16% |
| PEG ⓘ | 3.62 | |
Growth (Business expansion) | ||
| Revenue Growth ⓘ | -47.10% | 8.40% |
| RPS Growth (5Y CAGR) ⓘ | 26.31% | 12.31% |
| EPS Growth (5Y CAGR) ⓘ | 58.12% | -4.03% |
| BVPS Growth (5Y CAGR) ⓘ | -18.25% | 4.96% |
| Margin Growth (5Y Trend) ⓘ | 33.70% | -4.14% |
| FCF Growth (5Y CAGR) ⓘ | 31.51% | 4.70% |
| DPS Growth (5Y CAGR) ⓘ | 3.56% | 8.85% |
Quality (Business durability) | ||
| ROIC (Latest) ⓘ | 20.74% | 9.35% |
| ROE (Latest) ⓘ | 42.74% | 13.95% |
| ROA (Latest) ⓘ | 3.16% | 1.57% |
| ROIC (5Y Median) ⓘ | 27.29% | 7.78% |
| ROE (5Y Median) ⓘ | 52.01% | 12.12% |
| ROA (5Y Median) ⓘ | 3.75% | 1.28% |
| Net Debt / EBIT (Latest) ⓘ | 0.41 | 0.98 |
| Net Debt / EBIT (5Y Median) ⓘ | 0.07 | 0.73 |
| Net Debt / EBITDA (Latest) ⓘ | 0.46 | 0.78 |
| Operating Margin (Latest) ⓘ | 33.01% | 22.61% |
| Operating Margin (5Y Median) ⓘ | 26.50% | 24.52% |
| Debt to Equity (Latest) ⓘ | 20.54% | 58.76% |
| Profit Margin (Latest) ⓘ | 16.20% | 26.18% |
| Free Cash Flow (Latest) ⓘ | $2.82B | |
Momentum (Price trend) | ||
| 3Y Return ⓘ | +57.44% | +95.53% |
| 12M Return (excl. last month) ⓘ | +26.01% | +16.22% |
| 6M Return ⓘ | +10.83% | +7.41% |
| Price vs. 200-Day MA ⓘ | +9.55% | +5.55% |
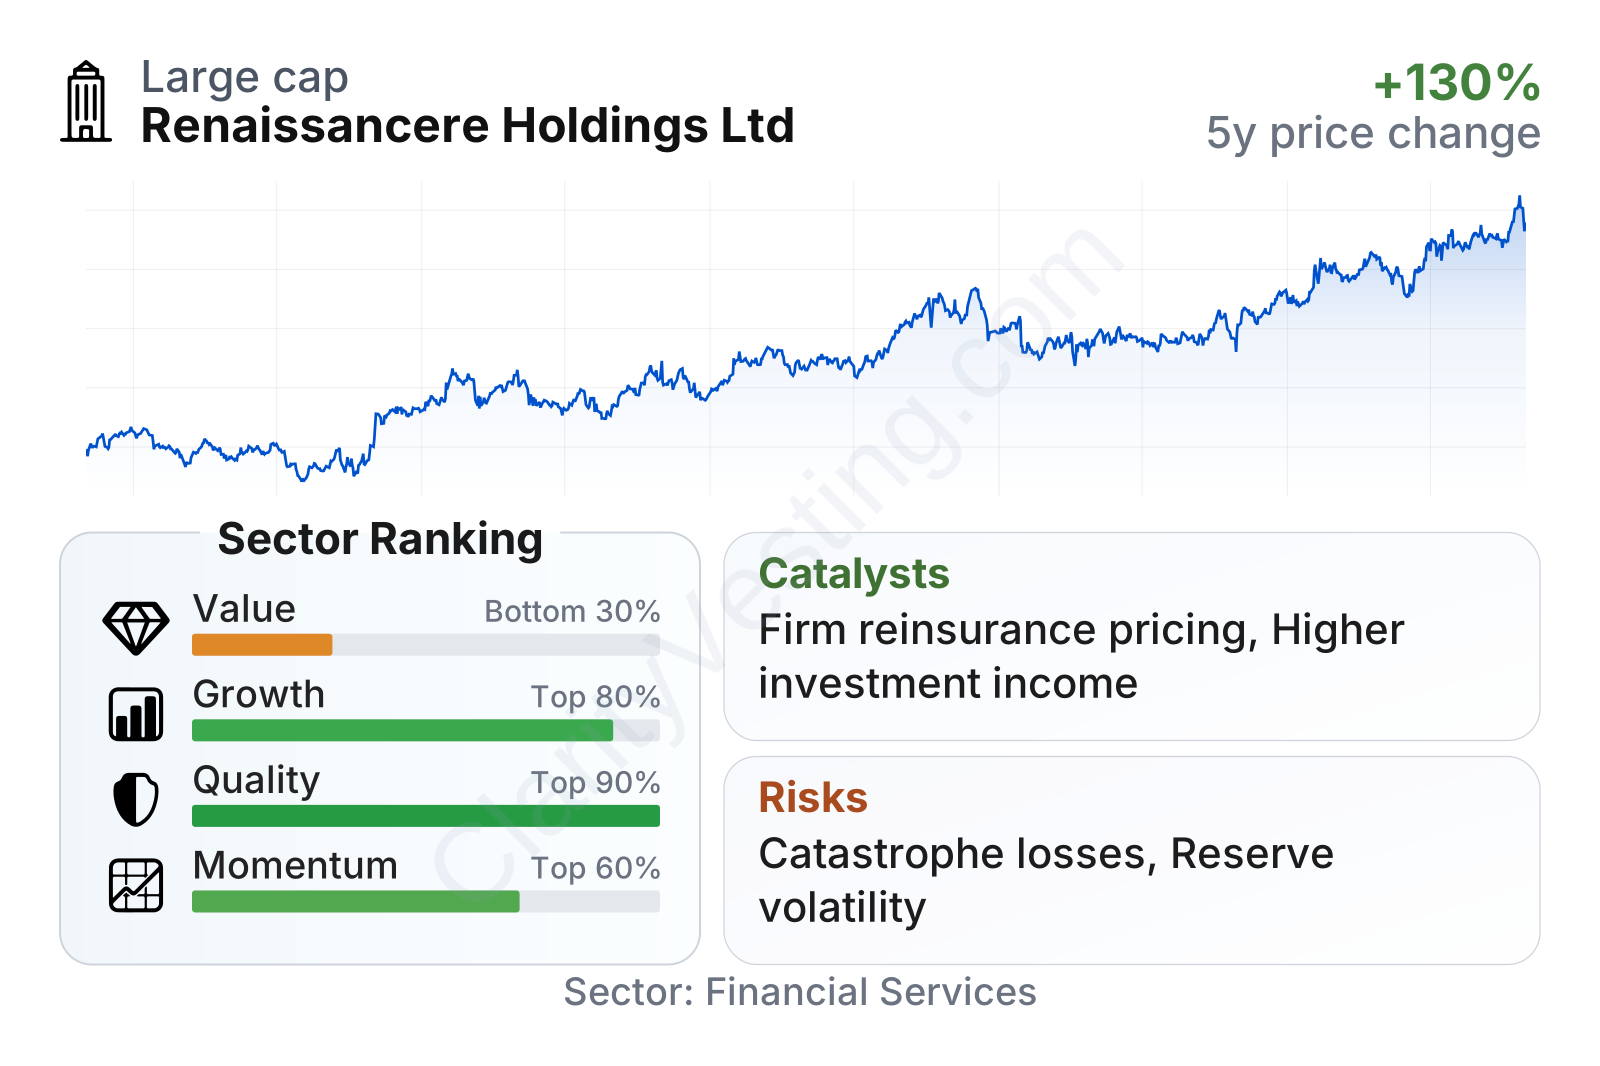
RenaissanceRe stands out on quality and growth relative to much of the financial sector. Profitability measures are well above sector medians, leverage is comparatively modest, and free cash flow generation is strong. The weaker point in the table is conventional value scoring: the stock trades on a low earnings multiple, but a clearly elevated price-to-book ratio pulls the overall value picture down. Momentum is solid rather than extreme, with a strong longer-term rise in the share price and moderate recent gains.
The stock’s beta is very low, which means it has historically moved less than the broader market. That can look unusual for a catastrophe-exposed reinsurer, but it reflects the fact that company-specific underwriting cycles and book value changes can matter more here than daily market swings. The dividend yield is low, so the equity case is much more tied to earnings power and capital compounding than to income.
Growth
RenaissanceRe operates in a sector that should remain relevant for a very long time. Climate-related volatility, rising insured values, and growing demand for risk transfer all support the need for reinsurance capacity. At the same time, many primary insurers want to reduce peak catastrophe exposure on their own balance sheets, which can increase demand for specialized reinsurers. That creates a favorable background for companies that can price risk accurately and move capital quickly.
The company’s strategy is also aligned with where the industry is heading. RenaissanceRe has long focused on analytical underwriting, portfolio construction, and selective risk-taking rather than chasing market share at any price. In a business where poor underwriting can destroy years of gains, this discipline matters. The addition of broader casualty and specialty operations has also made the group less concentrated than a pure catastrophe reinsurer, giving it more ways to grow when one market softens.
Earnings per share have risen dramatically since 2021, although the path is not smooth. That pattern is typical in reinsurance: profits can surge when pricing is favorable and catastrophe losses are manageable, then cool down when claims normalize or reserve movements change. Even with that volatility, the multi-year trajectory points to a much stronger earnings base than the company had earlier in the decade.
Book value per share tells a more complicated story. It fell sharply after the difficult 2022 period and has only partially recovered. For an insurer, book value is an important measure because it represents the capital base supporting underwriting. The rebound since 2024 is encouraging, but the earlier decline shows that capital can be hit hard when markets or catastrophe experience turn unfavorable. Long-term growth will depend not only on generating profit, but on rebuilding and compounding book value consistently.
A meaningful catalyst for future growth is the industry pricing environment. Reinsurance rates have remained firm in several property-catastrophe classes after years of elevated losses and tighter capital across the market. Higher interest rates also help investment income, which can support returns even when underwriting conditions are less exceptional. In addition, the company’s larger scale after recent strategic expansion gives it more room to allocate capacity toward the most attractive opportunities.
Recent company updates have also emphasized active capital management, portfolio optimization, and integration benefits from prior acquisitions. For a reinsurer, this matters because growth is not just about writing more premium; it is about writing better premium at adequate returns. If favorable pricing persists and catastrophe losses stay within modeled expectations, the current platform appears capable of producing strong earnings.
Risks
This article is for informational purposes only and does not constitute financial advice. Some content is AI-generated. See Disclaimer


