Stock Analysis · Whirlpool Corporation (WHR)
Overview
Whirlpool Corporation is a large home appliance manufacturer best known for products such as refrigerators, washers, dryers, dishwashers, cooking appliances, mixers, and other kitchen and laundry equipment. Its portfolio includes Whirlpool, KitchenAid, Maytag, JennAir, Amana, and several regional brands. The company sells to retailers, homebuilders, distributors, and directly through digital channels, with demand tied mainly to housing activity, remodeling, replacement cycles, and consumer spending.
Whirlpool’s revenue mix is primarily geographic. Based on recent annual reporting, North America remains the dominant profit engine, while the company also has meaningful exposure to Latin America, Asia, and a smaller contribution from Europe, the Middle East, and Africa where the business footprint has been reduced in recent years. Approximate revenue sources, ranked from largest to smallest, are:
- Major domestic appliances such as laundry, refrigeration, dishwashing, and cooking products: the vast majority of sales, roughly more than 85% of total revenue.
- Small domestic appliances and related products, including premium kitchen preparation categories tied to brands such as KitchenAid: roughly less than 15% of revenue.
From a geographic point of view, the mix is approximately:
- North America: about 75% to 80% of revenue, including the U.S. and Canada appliance business.
- Latin America: about 15% to 20% of revenue, led by Brazil and surrounding markets.
- Asia: about 5% to 10% of revenue.
- Europe, Middle East and Africa: now a relatively small share after portfolio changes, generally below 5%.
Over the last several years, the business has become smaller in revenue terms, and the profit stream has been far less stable than it was during the post-pandemic demand surge. The financial flow also shows a clear pattern: sales have declined meaningfully since 2021, gross profit has compressed, and interest expense has remained elevated enough to weigh on net income.
Key Figures
| Metric | Value | Sector ⓘ |
|---|---|---|
| Date | Sep 12, 2026 | |
| Context | ||
| Sector | Consumer Cyclical | |
| Industry | Furnishings, Fixtures & Appliances | |
| Market Cap ⓘ | $2.30B | |
| Beta ⓘ | 1.15 | |
Value (Cheapness) | ||
| P/E Ratio ⓘ | 11.58 | 17.10 |
| FCF Yield ⓘ | -7.01% | 8.53% |
| EBIT / EV ⓘ | 6.66% | 6.46% |
| PEG ⓘ | 1.04 | |
Growth (Business expansion) | ||
| Revenue Growth ⓘ | -6.80% | 5.75% |
| RPS Growth (5Y CAGR) ⓘ | -5.71% | 9.14% |
| EPS Growth (5Y CAGR) ⓘ | -60.27% | -18.21% |
| Margin Growth (5Y Trend) ⓘ | -6.10% | -0.23% |
| FCF Growth (5Y CAGR) ⓘ | -51.41% | 4.91% |
Quality (Business durability) | ||
| ROIC (Latest) ⓘ | 4.70% | 12.61% |
| ROIC (5Y Median) ⓘ | 6.26% | 10.72% |
| Net Debt / EBIT (Latest) ⓘ | 11.18 | 2.10 |
| Net Debt / EBIT (5Y Median) ⓘ | 7.69 | 2.32 |
| Operating Margin (Latest) ⓘ | 4.09% | 9.25% |
| Operating Margin (5Y Median) ⓘ | 4.85% | 9.64% |
| Debt to Equity (Latest) ⓘ | 204.86% | 75.78% |
| Profit Margin (Latest) ⓘ | 1.25% | 5.33% |
| Free Cash Flow (Latest) ⓘ | -$161.00M | |
Momentum (Price trend) | ||
| 3Y Return ⓘ | -69.79% | +14.53% |
| 12M Return (excl. last month) ⓘ | -48.21% | +3.08% |
| 6M Return ⓘ | -38.38% | +0.55% |
| Price vs. 200-Day MA ⓘ | -37.65% | -0.54% |
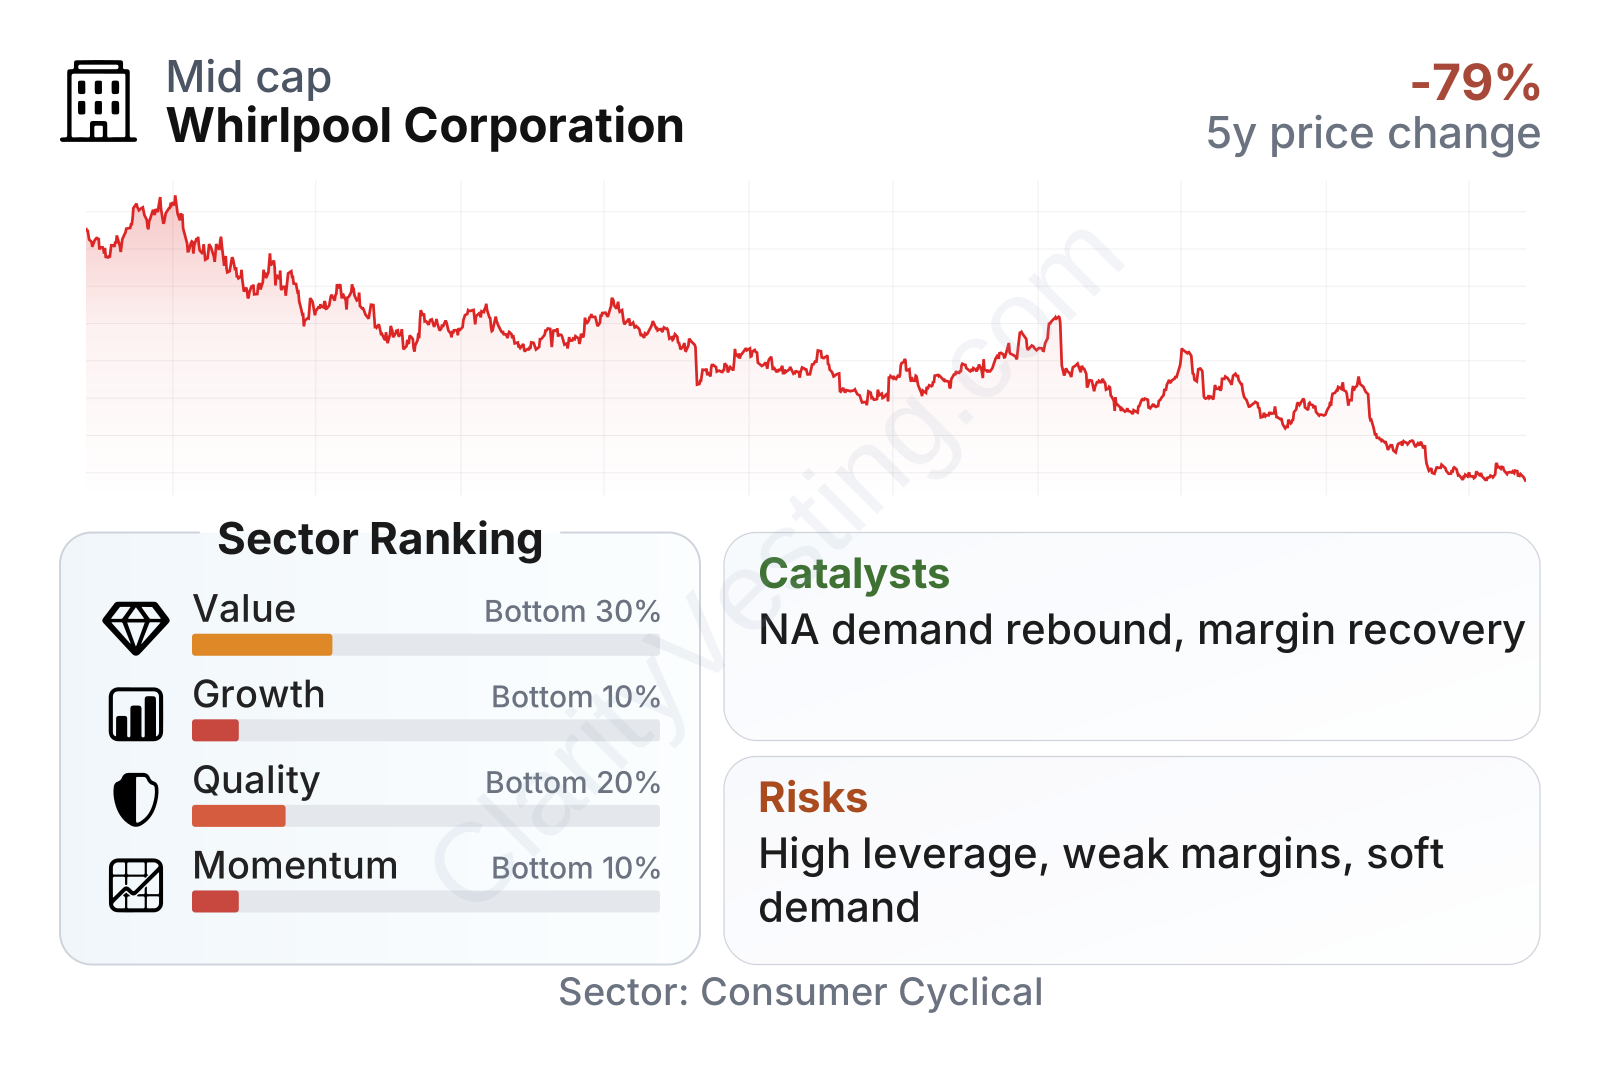
Whirlpool currently sits in the lower end of the sector on value, growth, quality, and momentum when the main operating indicators are compared with peers. The stock’s earnings multiple is below the sector median, but that lower multiple comes alongside weak revenue trends, thin profitability, and negative trailing free cash flow. The company is also relatively small by market value for a global appliance group, and its share price has been extremely volatile, with a beta a little above 1 and a very steep decline over the last three years.
Growth
Whirlpool operates in a sector that is mature rather than structurally fast-growing. Home appliances benefit from long-term demand drivers such as household formation, replacement needs, urbanization in some international markets, and the spread of more energy-efficient products. Still, this is not a market where volume typically grows at high rates year after year. Results are usually shaped more by housing turnover, renovation activity, pricing, product mix, and cost discipline than by rapid unit expansion.
Whirlpool’s strategy for future growth appears centered on a familiar set of levers: leaning into stronger brands, focusing on higher-margin categories, simplifying the portfolio, improving cost efficiency, and using product innovation to defend pricing. That logic makes sense for a cyclical manufacturer. The challenge is that execution has to overcome soft demand and margin pressure at the same time. Recent revenue patterns have remained weak, with year-over-year sales often negative and the latest reading still below the sector median by a wide margin.
Cash generation tells a similar story. Whirlpool has shown that it can recover free cash flow during better periods, but the pattern has been uneven, moving from strong positive levels to near break-even or negative territory more than once. For a long-term view, that matters because a manufacturer with volatile cash generation has less flexibility to invest, reduce debt, or absorb downturns.
The most important catalyst is a recovery in North American appliance demand. If housing turnover, remodeling, and replacement purchases improve, Whirlpool’s scale in major appliances gives it meaningful operating leverage. Another catalyst is margin recovery from productivity actions, supply chain simplification, and a richer mix of premium products. The company has also continued to emphasize innovation tied to energy efficiency, connected features, and kitchen and laundry upgrades, which can support pricing if consumers keep trading up.
Recent corporate updates have also pointed to continued portfolio shaping and cost actions rather than a dramatic new expansion plan. That is not a high-growth narrative, but it can still be significant: when a cyclical manufacturer cuts complexity and protects brand strength, even modest demand normalization can have a noticeable effect on earnings.
Risks
This article is for informational purposes only and does not constitute financial advice. Some content is AI-generated. See Disclaimer


