Stock Analysis · Dorman Products Inc (DORM)
Overview
Dorman Products is an automotive replacement parts company focused mainly on the aftermarket, which means it sells parts used to repair vehicles that are already on the road rather than parts installed when a new vehicle is built. Its catalog covers a very wide range of components for passenger cars, light trucks, and some heavy-duty applications, including chassis parts, body hardware, electrical items, sensors, fasteners, engine-related components, and specialty repair solutions. A central part of Dorman’s model is identifying common vehicle failures and offering replacement parts that are easier to source, easier to install, or unavailable from the original manufacturer.
The business is built around both breadth and problem-solving. Dorman is known for carrying hundreds of thousands of stock-keeping units and for designing many parts as direct solutions to recurring repair issues. That gives it a different position from a basic commodity supplier: it is not only distributing parts, but also selecting, engineering, and packaging repair products for professional repair shops, retailers, and warehouse distributors.
Revenue is primarily organized by product categories and sales channels. Based on recent annual reporting, the business mix is approximately as follows:
- Light Duty products: about 80% to 85% of revenue. This is the largest business and includes parts for passenger vehicles and light trucks sold through the automotive aftermarket.
- Specialty Vehicle products: about 10% to 15% of revenue. This includes heavy-duty, fleet, and specialty replacement parts, with an important contribution from the SuperATV business acquired in recent years.
- Other and smaller categories: about 3% to 8% of revenue. This can include adjacent channels, smaller product lines, and business-to-business activity outside the core light-duty aftermarket.
By customer type, sales are concentrated in large aftermarket channels such as warehouse distributors, retail chains, and buying groups, which then supply repair shops and end customers. The company’s revenue is also heavily U.S.-based, although it has some international reach.
Over the last several years, Dorman’s revenue has grown from about $1.35 billion in 2021 to roughly $2.13 billion in 2025. Gross profit and operating income have also expanded, showing that the company has not relied only on volume growth; it has also improved the economics of the business as scale increased and acquisition integration progressed.
The operating picture has improved meaningfully since 2021: revenue moved above $2 billion, gross profit expanded faster than sales, and operating income rose from the low-$170 million range to just above $300 million by 2025. Interest expense also eased from the 2023 peak, which suggests a cleaner earnings profile after earlier acquisition-related balance sheet pressure.
Key Figures
| Metric | Value | Sector ⓘ |
|---|---|---|
| Date | Sep 12, 2026 | |
| Context | ||
| Sector | Consumer Cyclical | |
| Industry | Auto Parts | |
| Market Cap ⓘ | $3.76B | |
| Beta ⓘ | 0.98 | |
Value (Cheapness) | ||
| P/E Ratio ⓘ | 17.54 | 17.10 |
| FCF Yield ⓘ | 5.70% | 8.53% |
| EBIT / EV ⓘ | 6.02% | 6.46% |
| PEG ⓘ | 1.17 | |
Growth (Business expansion) | ||
| Revenue Growth ⓘ | 0.70% | 5.75% |
| RPS Growth (5Y CAGR) ⓘ | 13.26% | 9.14% |
| EPS Growth (5Y CAGR) ⓘ | -0.67% | -18.21% |
| Margin Growth (5Y Trend) ⓘ | 1.49% | -0.23% |
| FCF Growth (5Y CAGR) ⓘ | -1.54% | 4.91% |
Quality (Business durability) | ||
| ROIC (Latest) ⓘ | 10.94% | 12.61% |
| ROIC (5Y Median) ⓘ | 12.21% | 10.72% |
| Net Debt / EBIT (Latest) ⓘ | 1.77 | 2.10 |
| Net Debt / EBIT (5Y Median) ⓘ | 1.92 | 2.32 |
| Operating Margin (Latest) ⓘ | 13.23% | 9.25% |
| Operating Margin (5Y Median) ⓘ | 12.78% | 9.64% |
| Debt to Equity (Latest) ⓘ | 34.87% | 75.78% |
| Profit Margin (Latest) ⓘ | 10.18% | 5.33% |
| Free Cash Flow (Latest) ⓘ | $214.17M | |
Momentum (Price trend) | ||
| 3Y Return ⓘ | +64.13% | +14.53% |
| 12M Return (excl. last month) ⓘ | -10.72% | +3.08% |
| 6M Return ⓘ | +23.88% | +0.55% |
| Price vs. 200-Day MA ⓘ | +2.20% | -0.54% |
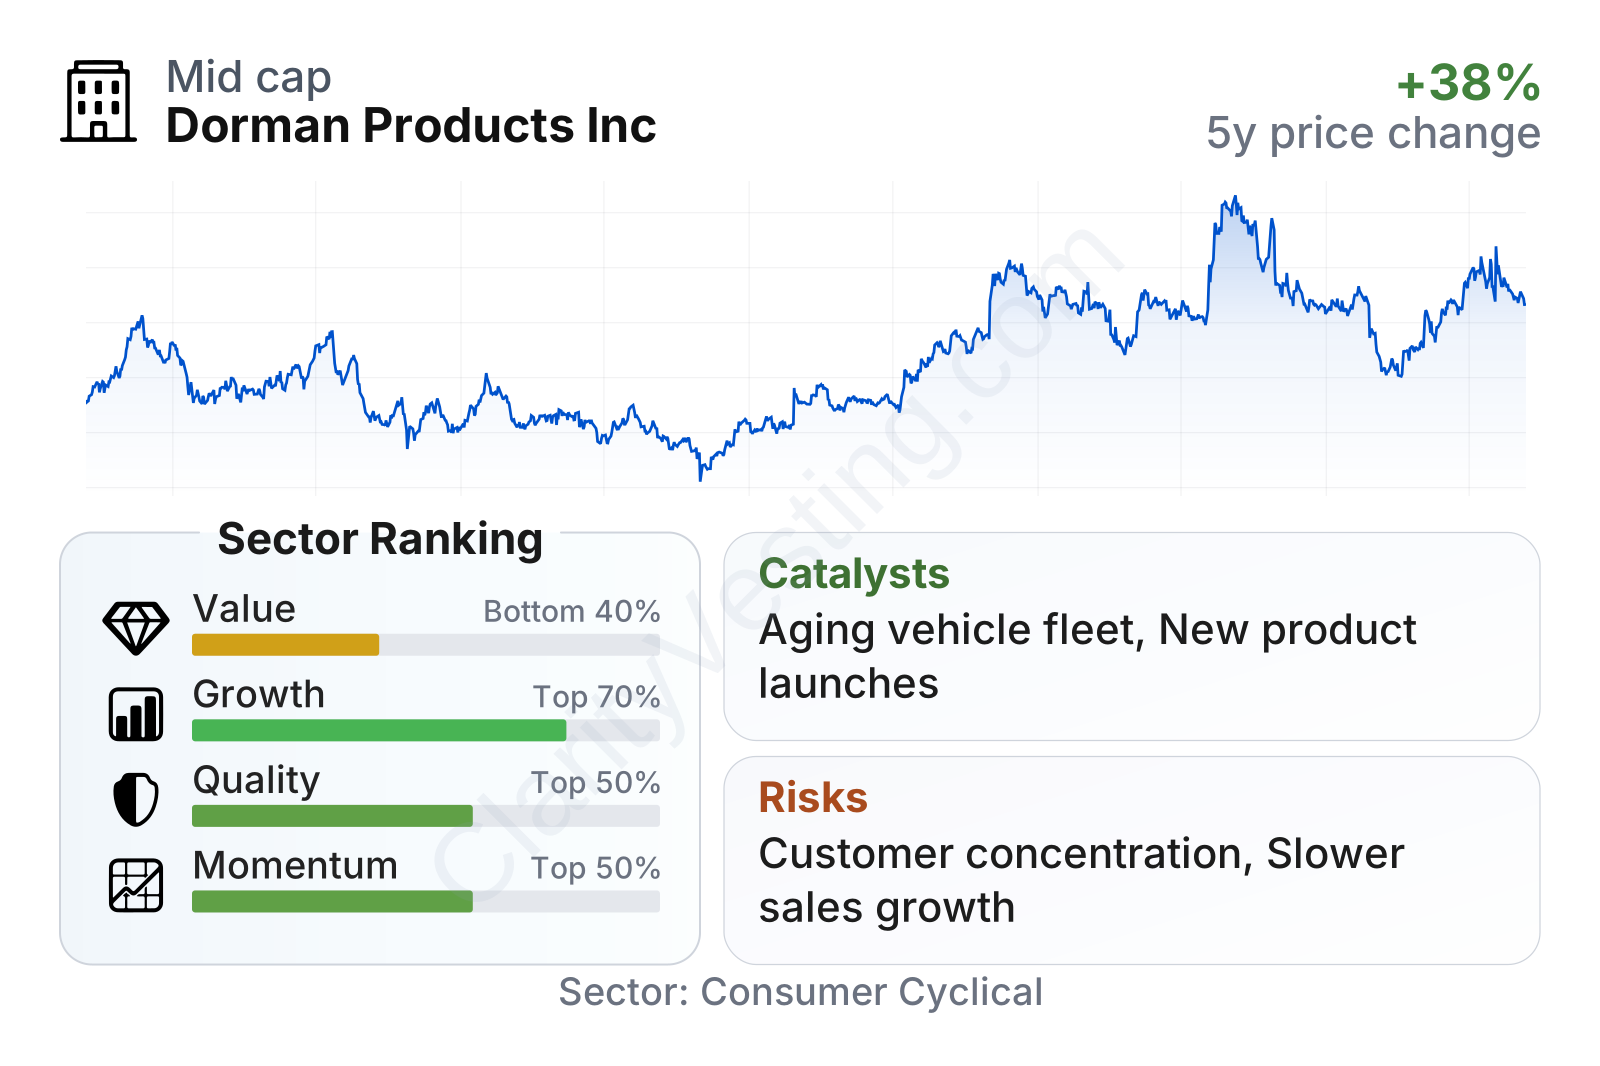
Dorman stands out more for business quality and execution than for deep value. Profitability is clearly stronger than the sector median, with operating margin around 13% and profit margin around 10%, both comfortably ahead of peers. Balance sheet leverage is also moderate, with debt-to-equity near 35%, far below the sector median. Growth is more mixed: long-term revenue-per-share growth has been solid, but recent year-over-year revenue growth has slowed to low single digits and free cash flow has been less consistent. Share price performance has been strong relative to much of the sector, which helps explain why the valuation is not especially cheap.
Growth
Dorman operates in a part of the auto industry that is usually more durable than new vehicle production. The long-term driver is the aging vehicle fleet: as cars and trucks stay on the road longer, owners and repair shops need more replacement parts. That is especially relevant in the United States, where the average age of vehicles has continued to rise. This is a supportive backdrop because older vehicles typically require more maintenance and more frequent component replacement.
The company’s strategy also makes sense for future growth. Instead of trying to compete only on low-cost commodity parts, Dorman focuses on hard-to-find items and engineered repair solutions. That can support better pricing and reduce direct comparison with the lowest-cost suppliers. It also gives the company a long runway to expand its catalog because every new vehicle generation eventually creates a fresh stream of aftermarket demand several years later.
Acquisitions have been another important growth lever. The purchase of SuperATV expanded Dorman beyond its traditional automotive repair niche into powersports and specialty vehicles. That added a different end market with its own growth profile and broadened the company’s product platform. The challenge now is less about deal-making and more about execution: integrating acquired businesses, expanding cross-selling, and maintaining margins while scaling.
Revenue growth was very strong in 2021 through 2023, helped by acquisitions and post-supply-chain normalization, then slowed materially in 2024 through 2026. Recent growth has been closer to flat-to-low-single-digit territory, which is well below the sector median. That does not necessarily break the long-term case, but it does mean the company currently looks more like a steady compounder than a rapid grower.
Cash generation has been positive over time, but not perfectly smooth. Free cash flow recovered sharply after a weak 2023 period, stayed strong in 2024 and 2025, and then softened again in the latest trailing period. For a parts company, that often reflects working capital swings, inventory timing, and acquisition integration costs. The key point is that Dorman still generates meaningful cash, but the path quarter to quarter can be uneven.
A practical catalyst is product expansion tied to the aging car parc, especially in newer vehicle systems where replacement demand is only beginning to build. Another is channel strength with large aftermarket customers, where broad catalog coverage can deepen shelf space and recurring orders. Recent company communications have also emphasized new product introductions, and that matters because Dorman’s model depends on continually refreshing its offering with parts that solve real repair problems.
Risks
This article is for informational purposes only and does not constitute financial advice. Some content is AI-generated. See Disclaimer


