Stock Analysis · Eerly Govt Ppty Inc (DEA)
Overview
Easterly Government Properties, Inc. is a specialized real estate investment trust, or REIT, focused on owning, developing, and operating properties leased primarily to U.S. government agencies. In simple terms, it buys and manages office and mission-critical buildings that federal tenants use for day-to-day operations. Its portfolio has historically centered on agencies such as the Department of Veterans Affairs, the Federal Bureau of Investigation, the Drug Enforcement Administration, and other federal entities whose space needs are tied to public services rather than typical private-sector office demand.
This business model matters because the company is not a general office landlord. Its properties are usually built or adapted for specific government uses, which can make tenant relationships stickier than in standard office real estate. Rent collection is therefore tied less to the health of the broader office market and more to federal occupancy, appropriations, lease renewals, and the company’s ability to keep acquiring or developing suitable assets.
The main sources of revenue are concentrated in rental income from government-leased properties, with smaller contributions from related real estate activities.
- Rental income from leased properties: the clear majority of revenue, estimated at well above 90%. This includes base rent paid under long-term leases by federal agencies and other tenants in owned buildings.
- Tenant reimbursements and operating recoveries: a smaller share, generally in the low-to-mid single-digit percentage range. This can include recoveries for property operating costs, depending on lease structure.
- Development and other property-related income: a limited share, typically only a small percentage. This reflects occasional contributions from development completions, lease termination items, parking, and other ancillary real estate sources.
The revenue mix is narrow, but intentionally so. Easterly’s identity is built around federal-credit tenants, not broad tenant diversification across industries.
Over the last several years, revenue has generally trended upward, while net income has remained much more pressured by financing costs. That pattern is important for understanding the company: the properties continue to generate rent, but the burden of interest expense has become a larger factor in what ultimately reaches the bottom line.
The operating picture shows a business with fairly steady property-level economics, but increasing interest expense has absorbed a larger share of earnings. Revenue moved higher from 2021 through 2025, while net income stayed comparatively modest, which reflects the financing-heavy nature of the REIT model in a higher-rate environment.
Key Figures
| Metric | Value | Sector ⓘ |
|---|---|---|
| Date | Oct 17, 2026 | |
| Context | ||
| Sector | Real Estate | |
| Industry | REIT - Office | |
| Market Cap ⓘ | $1.08B | |
| Beta ⓘ | 0.97 | |
Value (Cheapness) | ||
| P/E Ratio ⓘ | 116.47 | 17.38 |
| P/B Ratio ⓘ | 0.81 | 0.85 |
| FCF Yield ⓘ | 24.79% | 7.38% |
| Dividend Yield ⓘ | 7.95% | 4.85% |
| EBIT / EV ⓘ | 3.15% | 3.78% |
| PEG ⓘ | N/A | |
Growth (Business expansion) | ||
| Revenue Growth ⓘ | 9.20% | 5.30% |
| RPS Growth (5Y CAGR) ⓘ | 23.10% | 6.02% |
| EPS Growth (5Y CAGR) ⓘ | 7.65% | -11.37% |
| BVPS Growth (5Y CAGR) ⓘ | 16.93% | 0.45% |
| Margin Growth (5Y Trend) ⓘ | -0.22% | -0.22% |
| FCF Growth (5Y CAGR) ⓘ | 21.65% | 5.40% |
| DPS Growth (5Y CAGR) ⓘ | 15.45% | 5.02% |
Quality (Business durability) | ||
| ROIC (Latest) ⓘ | 2.29% | 5.69% |
| ROE (Latest) ⓘ | 0.77% | 7.56% |
| ROA (Latest) ⓘ | 0.30% | 2.85% |
| ROIC (5Y Median) ⓘ | 2.34% | 4.22% |
| ROE (5Y Median) ⓘ | 1.53% | 6.03% |
| ROA (5Y Median) ⓘ | 0.66% | 2.44% |
| Net Debt / EBIT (Latest) ⓘ | 19.49 | 7.59 |
| Net Debt / EBIT (5Y Median) ⓘ | 18.30 | 8.40 |
| Net Debt / EBITDA (Latest) ⓘ | 8.16 | 5.27 |
| Net Debt / Assets ⓘ | 50.38% | 37.76% |
| EBITDA / Interest ⓘ | 1.38 | 4.10 |
| Operating Margin (Latest) ⓘ | 24.72% | 35.29% |
| Operating Margin (5Y Median) ⓘ | 26.41% | 37.31% |
| Debt to Equity (Latest) ⓘ | 131.11% | 88.87% |
| Profit Margin (Latest) ⓘ | 2.81% | 19.61% |
| Free Cash Flow (Latest) ⓘ | $268.81M | |
Momentum (Price trend) | ||
| 3Y Return ⓘ | +3.56% | +30.75% |
| 12M Return (excl. last month) ⓘ | +9.84% | +4.36% |
| 6M Return ⓘ | -1.74% | -2.52% |
| Price vs. 200-Day MA ⓘ | -4.11% | -2.34% |
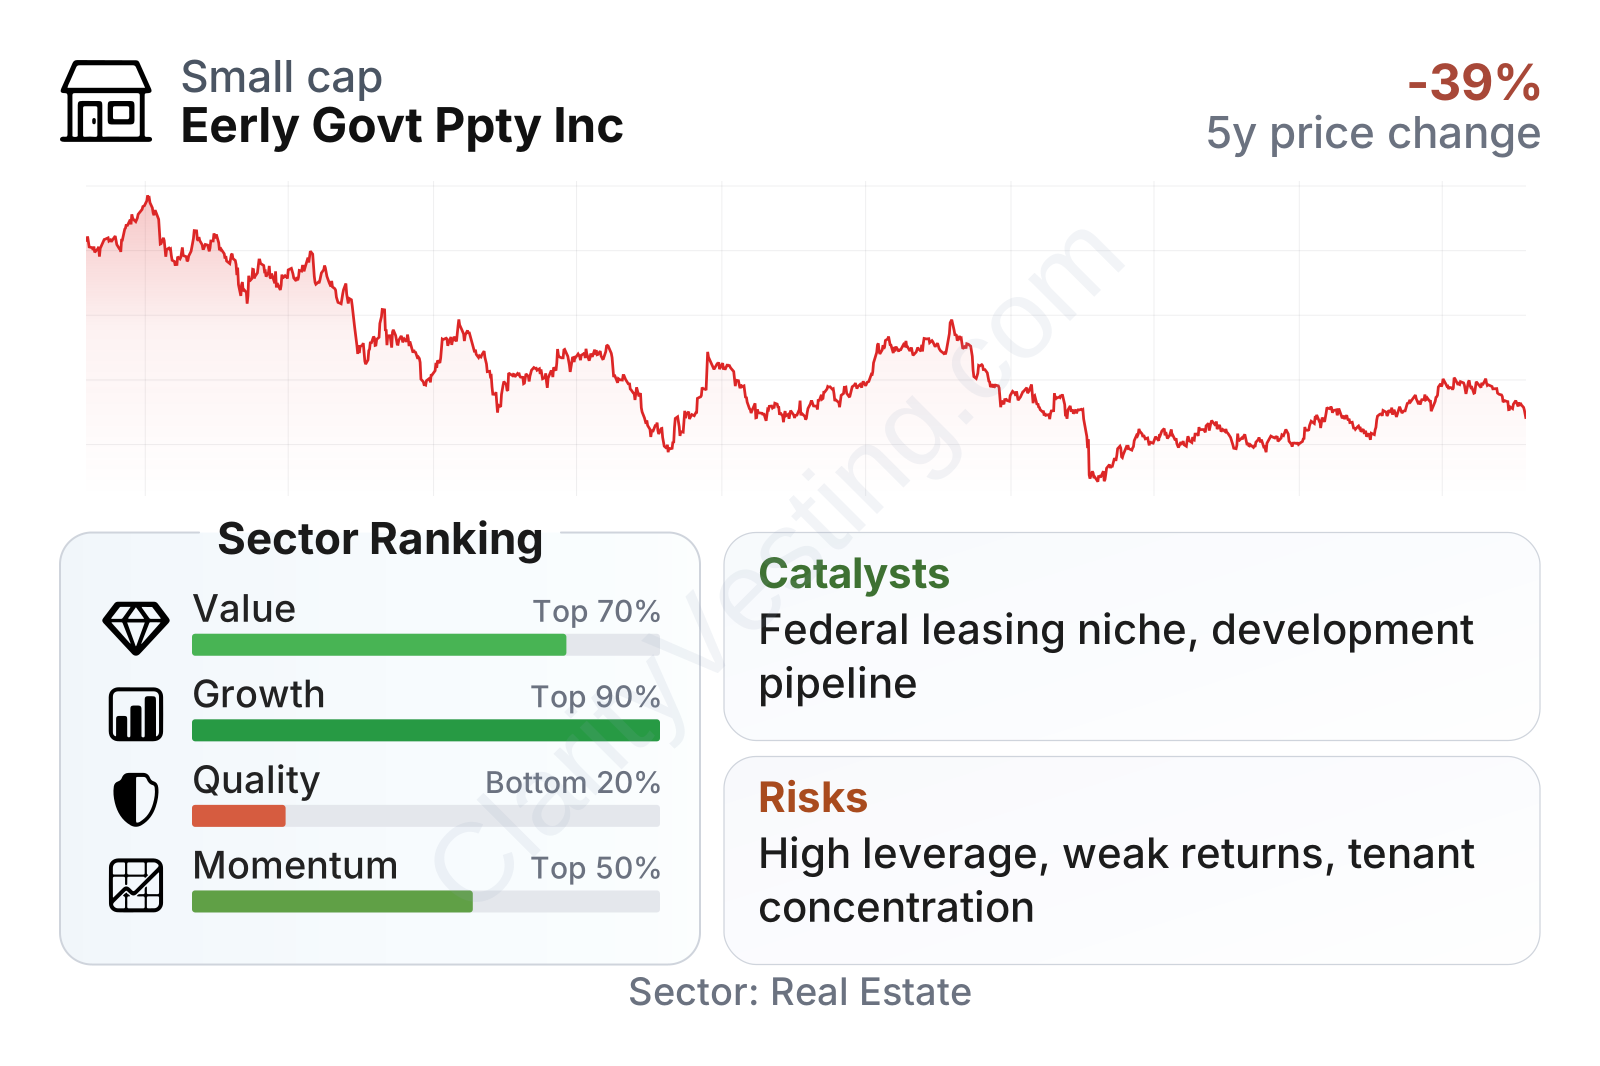
Easterly is a small-cap REIT with a stock that has been volatile over the past few years, including a long decline from 2022 into 2025 followed by a partial recovery in 2026. In the factor snapshot, growth stands out as the strongest area relative to the real estate sector, while quality looks weak. Value is mixed: the dividend yield and free cash flow yield look strong compared with peers, but earnings-based multiples are less useful here because net income is heavily compressed by depreciation and interest costs, which often distort P/E for REITs.
Growth
Easterly operates in a niche that is more resilient than traditional office real estate, but not necessarily fast-growing. Demand for federal facilities tends to be steadier because it depends on government functions such as healthcare, law enforcement, justice, and administrative operations. That gives the company exposure to a segment of office real estate that is less cyclical than private-sector office demand, even if it is still affected by lease timing, funding decisions, and property-level execution.
The company’s strategy is logical for long-term expansion. It focuses on mission-oriented federal buildings, selective acquisitions, and development opportunities where agencies need specialized space. This specialization can create a useful barrier to entry because not every landlord has the relationships, construction knowledge, security requirements, and underwriting discipline needed to serve federal tenants well. If managed carefully, that can support recurring lease activity and incremental portfolio growth over time.
Revenue per share has risen strongly over five years, which suggests the company has been able to expand its asset base and rental stream faster than share dilution has offset that progress. That is an encouraging sign for a REIT, since issuing equity is common in the sector and can otherwise weaken per-share growth.
The dividend record also shows meaningful long-term growth, even though the most recent period was weaker than the earlier trend. For a REIT, dividend durability matters because it reflects how much recurring property cash generation the portfolio can support after financing and operating costs. The current yield remains notably above the sector median, which indicates the market is demanding a higher income return to compensate for perceived risk.
One practical catalyst is the company’s positioning around government tenancy at a time when many office landlords are still dealing with weak private-sector demand. Another is its development and acquisition pipeline: when federal agencies consolidate, modernize, or replace older facilities, Easterly can potentially capture new projects. Recent company communications in 2026 have continued to emphasize leasing, acquisitions, development execution, and capital allocation as the main drivers of future results.
Risks
This article is for informational purposes only and does not constitute financial advice. Some content is AI-generated. See Disclaimer


