Stock Analysis · HCI Group Inc (HCI)
Overview
HCI Group is a property and casualty insurance company focused mainly on homeowners insurance in the United States, with a strong concentration in Florida. The group underwrites policies through insurance subsidiaries, manages claims, buys reinsurance to protect itself from large catastrophe losses, and also owns a smaller real estate operation. In simple terms, its core business is collecting insurance premiums, investing part of that float, and trying to price risk well enough to earn an underwriting profit over time.
The business is more specialized than many larger insurers. HCI has built its position in markets where some national carriers have pulled back, especially in Florida’s difficult home insurance market. That can create attractive pricing when conditions are favorable, but it also means results can swing more sharply when storms, claims inflation, or reinsurance costs move the wrong way.
Based on recent company reporting, HCI’s revenue mix is heavily centered on insurance operations.
- Net premiums earned: the largest source of revenue, likely around 75% to 85% of total revenue in recent periods. This is the portion of policy premiums recognized over the coverage period.
- Net investment income: generally a smaller but meaningful contributor, roughly 5% to 10%. This comes from the company’s investment portfolio, mainly fixed-income securities and other invested assets.
- Realized and unrealized gains, plus other insurance-related income: often variable, and in stronger years can account for roughly 10% to 20% combined. These items can include gains on investments and changes in reinsurance-related recoveries or other operating items.
- Real estate operations: a minor contributor, usually a low-single share of group revenue, tied to property ownership and related activities.
What stands out in recent years is how sharply profitability improved after the difficult 2022 period. Revenue expanded materially from 2023 through 2025, while costs did not rise at the same pace, leading to a much stronger earnings profile. That kind of recovery matters for an insurer because it suggests pricing, underwriting discipline, and reinsurance structure have recently worked much better than before.
The income flow also shows a major turnaround: the company moved from losses in 2022 to much stronger operating income and net income in 2023, 2024, and especially 2025. Revenue has risen strongly, while operating leverage has improved as expenses grew far more slowly than gross profit.
Key Figures
| Metric | Value | Sector ⓘ |
|---|---|---|
| Date | Oct 17, 2026 | |
| Context | ||
| Sector | Financial Services | |
| Industry | Insurance - Property & Casualty | |
| Market Cap ⓘ | $2.44B | |
| Beta ⓘ | 1.05 | |
Value (Cheapness) | ||
| P/E Ratio ⓘ | 8.57 | 12.26 |
| P/B Ratio ⓘ | 2.58 | 1.23 |
| FCF Yield ⓘ | 16.85% | 10.40% |
| Dividend Yield ⓘ | 0.80% | 3.02% |
| EBIT / EV ⓘ | 33.55% | 8.14% |
| PEG ⓘ | 0.97 | |
Growth (Business expansion) | ||
| Revenue Growth ⓘ | 11.10% | 9.35% |
| RPS Growth (5Y CAGR) ⓘ | 10.49% | 12.19% |
| EPS Growth (5Y CAGR) ⓘ | N/A | -9.53% |
| BVPS Growth (5Y CAGR) ⓘ | 18.92% | 4.99% |
| Margin Growth (5Y Trend) ⓘ | 44.31% | -3.86% |
| FCF Growth (5Y CAGR) ⓘ | 47.78% | 4.81% |
| DPS Growth (5Y CAGR) ⓘ | -2.24% | 8.79% |
Quality (Business durability) | ||
| ROIC (Latest) ⓘ | 32.51% | 9.49% |
| ROE (Latest) ⓘ | 34.37% | 13.90% |
| ROA (Latest) ⓘ | 12.43% | 1.55% |
| ROIC (5Y Median) ⓘ | 21.51% | 7.86% |
| ROE (5Y Median) ⓘ | 31.88% | 12.17% |
| ROA (5Y Median) ⓘ | 4.37% | 1.30% |
| Net Debt / EBIT (Latest) ⓘ | -1.74 | 0.96 |
| Net Debt / EBIT (5Y Median) ⓘ | -2.57 | 0.73 |
| Net Debt / EBITDA (Latest) ⓘ | -1.71 | 0.92 |
| Operating Margin (Latest) ⓘ | 48.83% | 22.30% |
| Operating Margin (5Y Median) ⓘ | 23.40% | 24.63% |
| Debt to Equity (Latest) ⓘ | 6.25% | 58.56% |
| Profit Margin (Latest) ⓘ | 32.60% | 26.57% |
| Free Cash Flow (Latest) ⓘ | $410.31M | |
Momentum (Price trend) | ||
| 3Y Return ⓘ | +244.03% | +88.33% |
| 12M Return (excl. last month) ⓘ | +5.55% | +19.38% |
| 6M Return ⓘ | +27.07% | +4.75% |
| Price vs. 200-Day MA ⓘ | +16.26% | +3.50% |
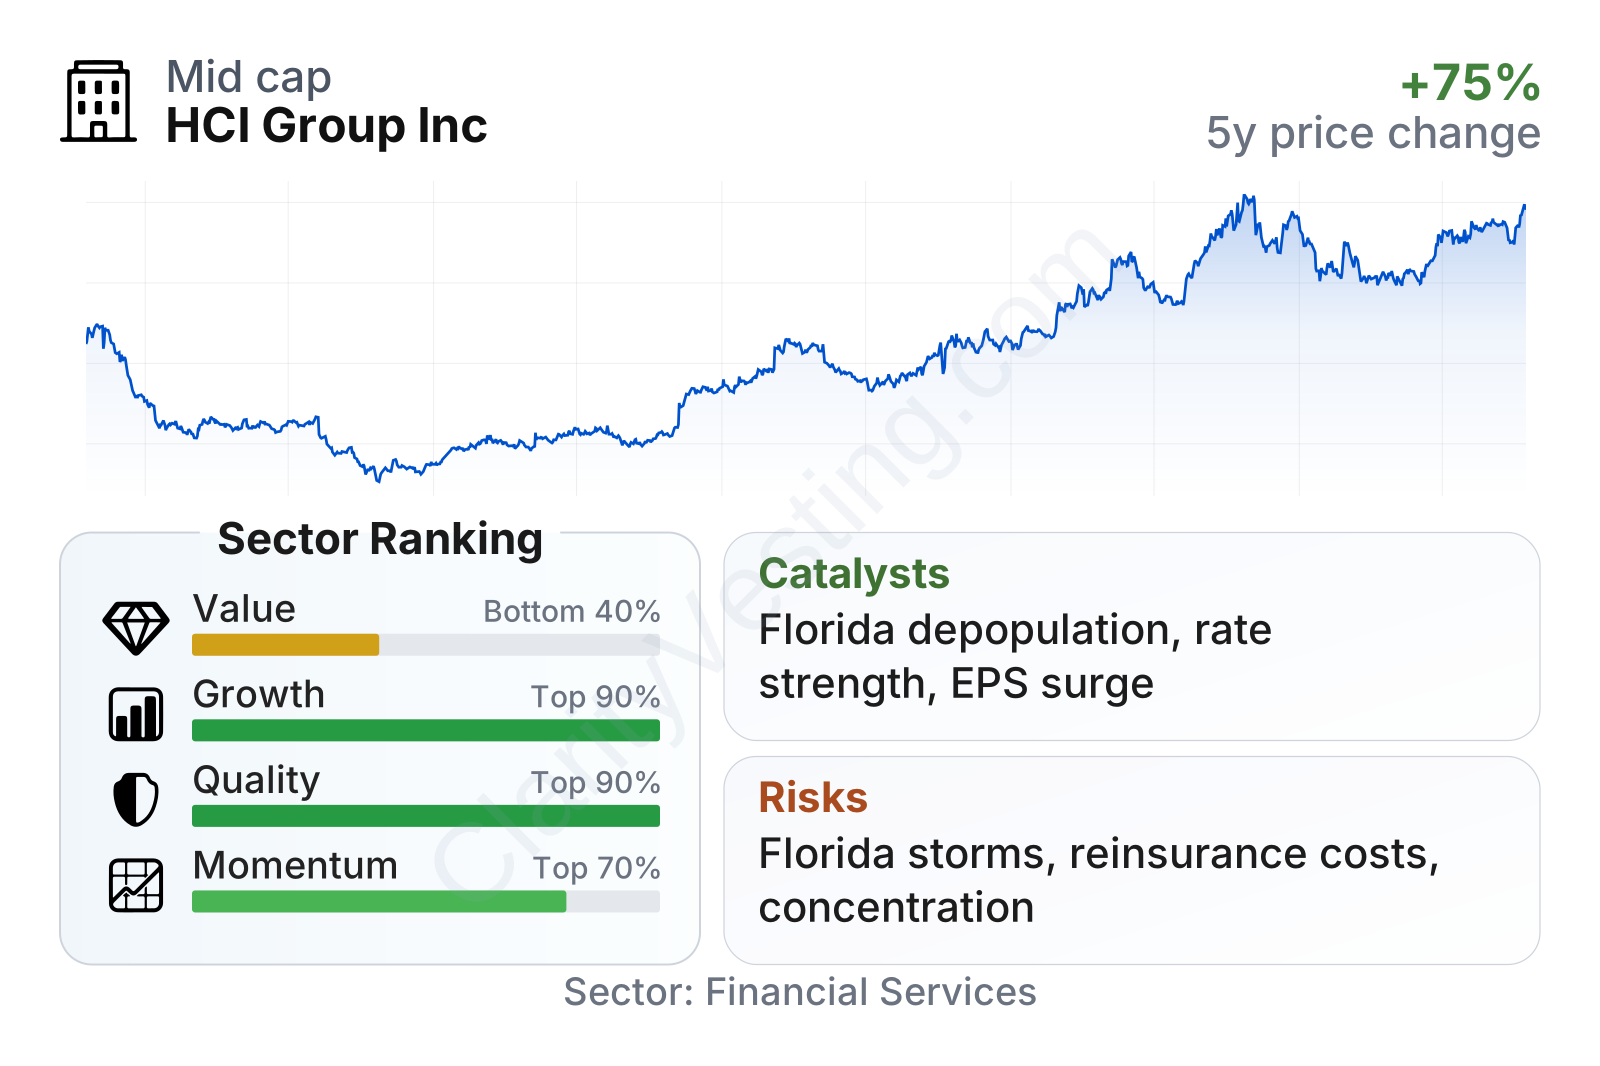
HCI is a mid-sized insurer with a market value around the low single-digit billions and a stock volatility close to the broader market. The table suggests a somewhat unusual profile: growth and quality rank very high versus the sector, while value ranks weaker overall despite a low earnings multiple. That mixed picture comes from the market assigning a premium to book value even though the stock still trades at a relatively modest multiple of earnings.
The stock’s longer-term share performance has been very strong, but shorter-term momentum is more ordinary. Operationally, profitability and cash generation look far stronger than the sector median, with high returns on capital, strong margins, very low leverage, and free cash flow well above many peers. In short, the company currently screens more like a high-performing niche insurer than a cheap deep-value name.
Growth
HCI operates in a sector that is not a classic high-growth industry, but it can still grow quickly when pricing conditions harden. Property insurance, especially in catastrophe-exposed regions, tends to expand in profitable phases when weaker competitors retreat and policy rates rise. That appears to be the environment HCI has been using. In states such as Florida, reduced capacity from some carriers has created room for specialized insurers with local expertise and sufficient reinsurance protection.
The company’s strategy is straightforward and economically sensible: focus on markets it knows well, push for rate adequacy, control underwriting exposure, and protect the balance sheet through reinsurance. If management can keep claim costs and catastrophe exposure within targets, that model can produce powerful earnings growth because premiums can scale faster than fixed overhead.
The earnings trend illustrates this operating leverage clearly. After a steep loss in 2022, earnings per share recovered strongly in 2023 and 2024, then accelerated sharply in 2025. That kind of rebound is important because it suggests the recent improvement is not only coming from revenue growth, but also from much better underwriting economics.
Book value per share has also rebounded strongly. For insurers, book value is one of the most useful indicators of long-term compounding because it reflects how effectively management is building capital after claims, expenses, and investment results. HCI’s five-year book value growth rate is far above the sector median, which points to meaningful value creation following the earlier drawdown.
A notable catalyst is the continued reshaping of the Florida insurance market. As regulation evolves, state-backed exposure is gradually shifted toward private carriers, and pricing remains firm, specialized insurers may gain opportunities to write more business at better terms. Another positive factor is HCI’s recent profitability level, which gives it more flexibility to retain capital, support policy growth, and potentially negotiate reinsurance from a stronger position.
Recent company communications have also emphasized ongoing policy growth, strong underwriting performance, and disciplined capital management. For a long-term reader, the important point is not one quarter by itself, but that HCI has recently shown it can convert a difficult market into much higher earnings and capital growth.
Risks
This article is for informational purposes only and does not constitute financial advice. Some content is AI-generated. See Disclaimer


