Stock Analysis · The Allstate Corporation (ALL)
Overview
The Allstate Corporation is one of the largest personal-lines insurers in the United States. Its core business is straightforward: it collects premiums from policyholders, invests part of that cash, and then pays claims when covered events happen. Allstate is best known for auto and homeowners insurance sold under the Allstate brand, but it also operates other personal property-casualty brands, protection plans, health and benefits businesses, and a meaningful investment portfolio tied to its insurance operations.
For long-term analysis, the key point is that Allstate is primarily a property and casualty insurer, with earnings driven by two engines: underwriting results and investment income. When pricing is disciplined and claims trends are favorable, profits can rise quickly. When catastrophe losses, inflation in repair costs, or reserve pressures hit the industry, results can swing sharply.
Based on recent company reporting, Allstate’s revenue mix is dominated by Property-Liability insurance, with a much smaller contribution from Protection Services and other activities. At a high level, the main sources of revenue are:
- Property-Liability premiums and related insurance revenue: approximately 85% to 90% of total revenue. This includes personal auto, homeowners, and other personal lines. Auto is the largest single product, while homeowners is also a major contributor.
- Net investment income: approximately 7% to 10%. Insurers invest premium float, usually in bonds and other income-producing assets, making interest rates an important earnings factor.
- Protection Services and other businesses: approximately 3% to 6%. This includes protection plans, device and product protection, roadside and related offerings, and certain employer voluntary benefits activities.
Over the past few years, the business mix has remained centered on personal insurance, but profitability has changed much more than revenue. Revenue has climbed from roughly the low-$50 billions range to the mid-$60 billions range over several years, while net income moved from strong profit to loss and then to a sharp recovery. That pattern reflects the insurance cycle: pricing actions can take time to earn through, but once they do, results can improve rapidly.
The broad trend is encouraging: revenue has grown steadily, while profitability recovered dramatically after the difficult 2022–2023 period. By 2025, operating income and net income had moved to much higher levels, suggesting that pricing, underwriting actions, and investment income were all working in the same direction.
Key Figures
| Metric | Value | Sector ⓘ |
|---|---|---|
| Date | Oct 17, 2026 | |
| Context | ||
| Sector | Financial Services | |
| Industry | Insurance - Property & Casualty | |
| Market Cap ⓘ | $59.72B | |
| Beta ⓘ | 0.14 | |
Value (Cheapness) | ||
| P/E Ratio ⓘ | 4.73 | 12.26 |
| P/B Ratio ⓘ | 1.84 | 1.23 |
| FCF Yield ⓘ | 20.51% | 10.40% |
| Dividend Yield ⓘ | 1.76% | 3.02% |
| EBIT / EV ⓘ | 26.48% | 8.14% |
| PEG ⓘ | 1.69 | |
Growth (Business expansion) | ||
| Revenue Growth ⓘ | 11.80% | 9.35% |
| RPS Growth (5Y CAGR) ⓘ | 10.38% | 12.19% |
| EPS Growth (5Y CAGR) ⓘ | N/A | -9.53% |
| BVPS Growth (5Y CAGR) ⓘ | 10.51% | 4.99% |
| Margin Growth (5Y Trend) ⓘ | 18.98% | -3.86% |
| FCF Growth (5Y CAGR) ⓘ | 19.97% | 4.81% |
| DPS Growth (5Y CAGR) ⓘ | 6.86% | 8.79% |
Quality (Business durability) | ||
| ROIC (Latest) ⓘ | 37.34% | 9.49% |
| ROE (Latest) ⓘ | 43.29% | 13.90% |
| ROA (Latest) ⓘ | 10.86% | 1.55% |
| ROIC (5Y Median) ⓘ | 1.70% | 7.86% |
| ROE (5Y Median) ⓘ | 5.77% | 12.17% |
| ROA (5Y Median) ⓘ | 4.34% | 1.30% |
| Net Debt / EBIT (Latest) ⓘ | 0.38 | 0.96 |
| Net Debt / EBIT (5Y Median) ⓘ | 5.64 | 0.73 |
| Net Debt / EBITDA (Latest) ⓘ | 0.37 | 0.92 |
| Operating Margin (Latest) ⓘ | 25.15% | 22.30% |
| Operating Margin (5Y Median) ⓘ | 1.42% | 24.63% |
| Debt to Equity (Latest) ⓘ | 22.23% | 58.56% |
| Profit Margin (Latest) ⓘ | 18.97% | 26.57% |
| Free Cash Flow (Latest) ⓘ | $12.25B | |
Momentum (Price trend) | ||
| 3Y Return ⓘ | +103.90% | +88.33% |
| 12M Return (excl. last month) ⓘ | +33.16% | +19.38% |
| 6M Return ⓘ | +10.83% | +4.75% |
| Price vs. 200-Day MA ⓘ | +6.86% | +3.50% |
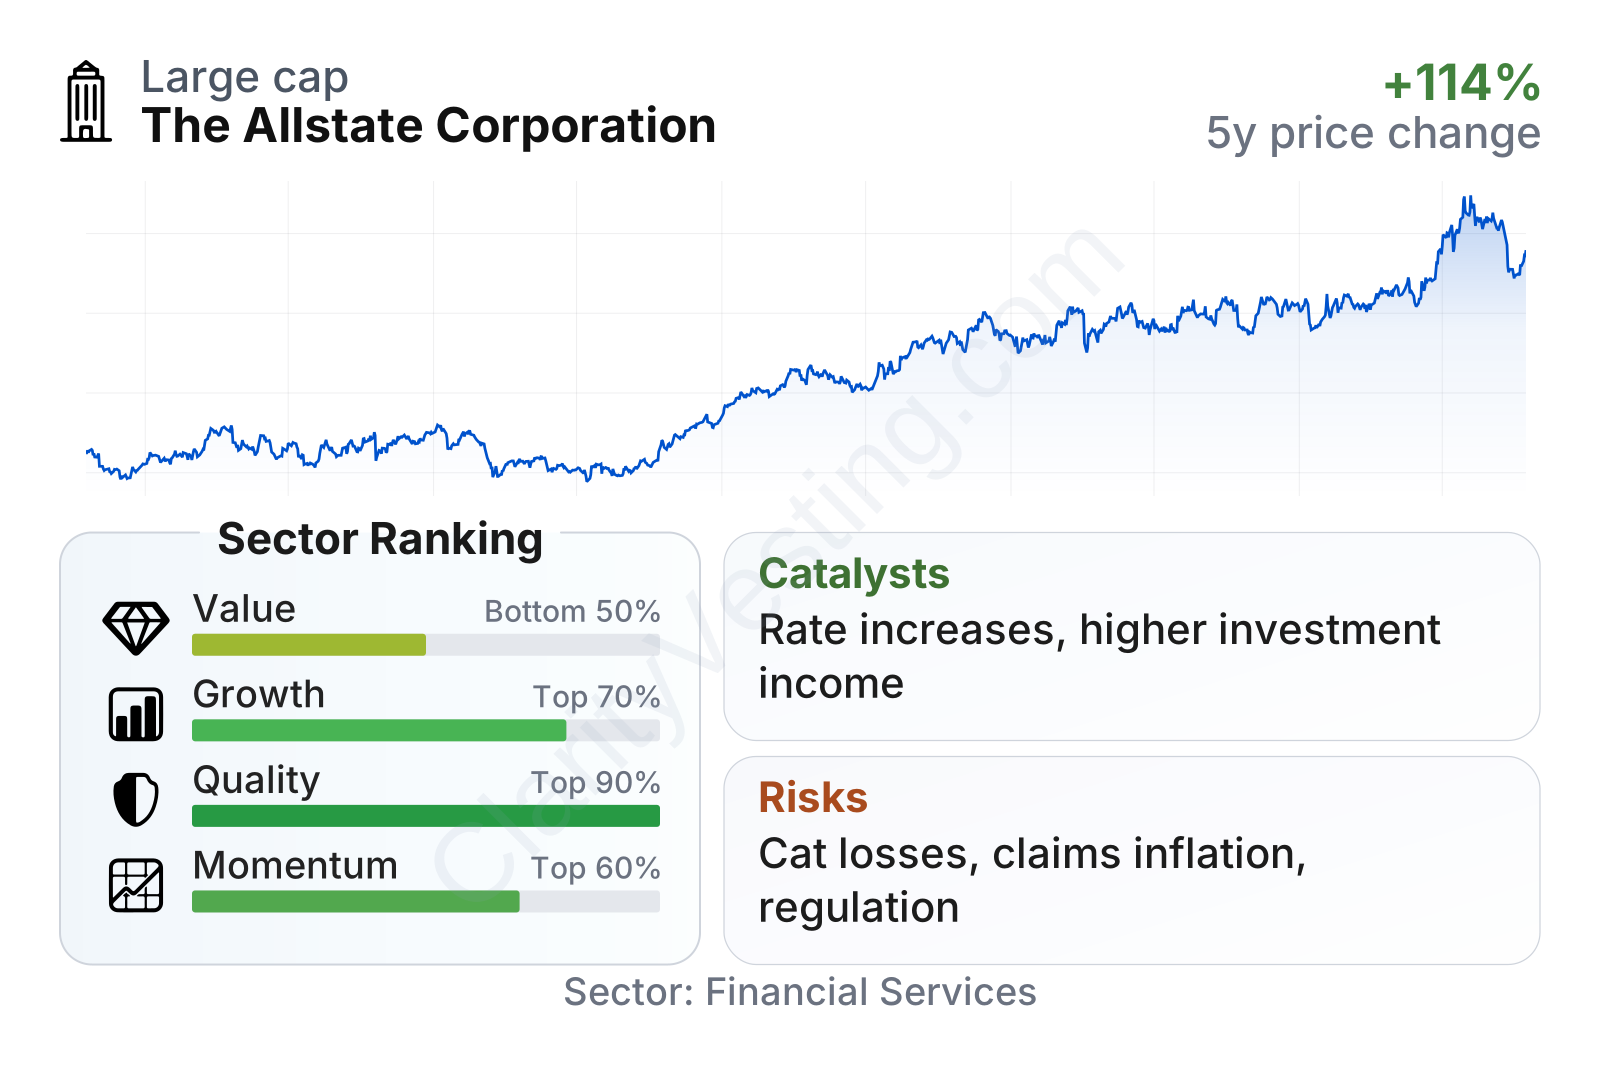
Allstate stands out for very strong current profitability and balance-sheet efficiency relative to much of the financial sector, even though its value ranking is mixed. The low earnings multiple suggests the market is not treating current profits as fully stable or permanent, while the above-sector price-to-book ratio shows that the company is not being valued like a distressed insurer. Growth and quality metrics are generally strong, especially returns on capital, returns on equity, free cash flow generation, and recent margin improvement. Momentum is more moderate in the short run, despite a very strong multi-year share-price recovery.
The stock chart shows a clear rerating since the 2023 trough. Shares were weak during the period of heavy underwriting pressure, then rose sharply as earnings normalized and capital strength improved. That makes the current setup different from a turnaround in distress: the market has already recognized a substantial portion of the operational recovery.
Growth
Allstate operates in a sector that is mature, but still structurally important and capable of long-term growth. Auto and homeowners insurance are essential products, and premium growth tends to come from rate increases, insured value inflation, population and vehicle growth, and cross-selling into adjacent protection products. This is not a fast-disruption industry, but it can produce attractive long-term compounding when underwriting discipline is strong.
The company’s recent strategy makes sense for this environment. After industry-wide pressure from elevated claims severity, catastrophe losses, and inflation in repair and replacement costs, Allstate focused on raising rates, tightening underwriting, reducing exposure in less attractive segments, and restoring margins. That approach can hurt growth temporarily in some markets, but it is usually healthier than chasing premium volume at inadequate prices.
The earnings trend highlights the scale of the recovery. Allstate moved from losses in 2022 and near-break-even results in 2023 to a much stronger profit level in 2024 and a further step-up in 2025. That kind of rebound matters because insurance earnings are highly sensitive to pricing adequacy. Once rates catch up with claims costs, incremental improvement can be powerful.
Book value per share also improved materially after the 2022 decline, and the five-year growth rate is well ahead of the sector median. For an insurer, book value is especially important because it reflects the capital base supporting underwriting and future growth. A rising book value combined with sharply improved earnings usually signals that the business is not only recovering on paper, but also rebuilding financial flexibility.
There are also concrete growth catalysts beyond pure rate increases. Higher interest rates have generally supported insurers’ investment income as maturing assets are reinvested at better yields. Allstate has continued to expand and refine its product and distribution capabilities across direct, exclusive agent, and independent channels. In addition, the company has been active in reshaping its portfolio, including transactions and business changes intended to focus capital on areas with stronger returns.
Recent company updates have also pointed to ongoing premium growth in key personal-lines products and continued efforts to improve profitability in homeowners insurance, where pricing discipline and risk selection are especially important after years of elevated catastrophe exposure across the industry. If these trends continue, future growth may come less from aggressive volume expansion and more from better-quality revenue and stronger returns on each policy written.
Risks
This article is for informational purposes only and does not constitute financial advice. Some content is AI-generated. See Disclaimer


