Stock Analysis · Absa Group Ltd (AGRPY)
Overview
Absa Group Ltd is a large African banking group headquartered in South Africa. It provides everyday banking, business lending, corporate and investment banking, insurance, payments, wealth services, and digital financial products. The company operates primarily in South Africa and also has meaningful operations in several other African markets including Ghana, Kenya, Botswana, Zambia, Mozambique, Mauritius, Seychelles, Tanzania, and Uganda.
Its business model is relatively easy to understand: Absa gathers deposits, lends money to households and businesses, earns fees from payments and account services, and provides more specialized products such as investment banking, treasury services, insurance, and asset management. Like many banks, its earnings are influenced by interest rates, credit quality, customer activity, and the broader economy.
Based on recent annual reporting, Absa’s revenue mix is led by South African retail and business banking, followed by corporate and investment banking, then the rest of Africa operations, with insurance and wealth-related activities adding a smaller but still meaningful contribution. Exact percentages vary by year and by reporting line, but the group’s profit and revenue base is still centered on South Africa.
- Retail and Business Banking South Africa: approximately 35% to 45% of group revenue. This includes home loans, vehicle finance, credit cards, personal loans, deposits, transactional banking, and banking for small and medium-sized businesses.
- Corporate and Investment Banking: approximately 25% to 35%. This covers lending to large companies, trade finance, treasury and markets activities, advisory work, and transaction banking.
- Absa Regional Operations: approximately 15% to 25%. This is the group’s banking activity outside South Africa across several African countries.
- Insurance and Wealth: approximately 5% to 10%. This includes life and non-life insurance, investment products, and wealth management.
Over the past few years, the group has shown a broad expansion in revenue and operating income, although banking line items can move around significantly because of interest-rate effects and accounting presentation. Net income has generally remained substantial, which supports the view that Absa is still a major, profitable financial institution rather than a turnaround case.
The broad direction is favorable: revenue and operating profit are materially higher than they were a few years ago, even though the path has not been perfectly smooth. That pattern fits a bank benefiting from higher activity, pricing power in lending, and a wide customer base across multiple African markets.
Key Figures
| Metric | Value | Sector ⓘ |
|---|---|---|
| Date | Oct 17, 2026 | |
| Context | ||
| Sector | Financial Services | |
| Industry | Banks - Regional | |
| Market Cap ⓘ | $10.38B | |
| Beta ⓘ | 0.35 | |
Value (Cheapness) | ||
| P/E Ratio ⓘ | 7.60 | 12.26 |
| P/B Ratio ⓘ | 0.07 | 1.23 |
| FCF Yield ⓘ | 34.32% | 10.40% |
| Dividend Yield ⓘ | 8.24% | 3.02% |
| EBIT / EV ⓘ | N/A | 8.14% |
| PEG ⓘ | N/A | |
Growth (Business expansion) | ||
| Revenue Growth ⓘ | 4.80% | 9.35% |
| RPS Growth (5Y CAGR) ⓘ | 25.84% | 12.19% |
| EPS Growth (5Y CAGR) ⓘ | 185.52% | -9.53% |
| BVPS Growth (5Y CAGR) ⓘ | 4.33% | 4.99% |
| Margin Growth (5Y Trend) ⓘ | -18.09% | -3.86% |
| FCF Growth (5Y CAGR) ⓘ | 133.20% | 4.81% |
| DPS Growth (5Y CAGR) ⓘ | 38.12% | 8.79% |
Quality (Business durability) | ||
| ROIC (Latest) ⓘ | 5.68% | 9.49% |
| ROE (Latest) ⓘ | 29.73% | 13.90% |
| ROA (Latest) ⓘ | 2.20% | 1.55% |
| ROIC (5Y Median) ⓘ | 6.35% | 7.86% |
| ROE (5Y Median) ⓘ | 14.61% | 12.17% |
| ROA (5Y Median) ⓘ | 1.15% | 1.30% |
| Net Debt / EBIT (Latest) ⓘ | 10.41 | 0.96 |
| Net Debt / EBIT (5Y Median) ⓘ | 5.43 | 0.73 |
| Net Debt / EBITDA (Latest) ⓘ | 7.75 | 0.92 |
| Operating Margin (Latest) ⓘ | 9.68% | 22.30% |
| Operating Margin (5Y Median) ⓘ | 33.72% | 24.63% |
| Debt to Equity (Latest) ⓘ | 272.97% | 58.56% |
| Profit Margin (Latest) ⓘ | 22.53% | 26.57% |
| Free Cash Flow (Latest) ⓘ | $3.56B | |
Momentum (Price trend) | ||
| 3Y Return ⓘ | +89.64% | +88.33% |
| 12M Return (excl. last month) ⓘ | +36.92% | +19.38% |
| 6M Return ⓘ | -4.00% | +4.75% |
| Price vs. 200-Day MA ⓘ | +10.72% | +3.50% |
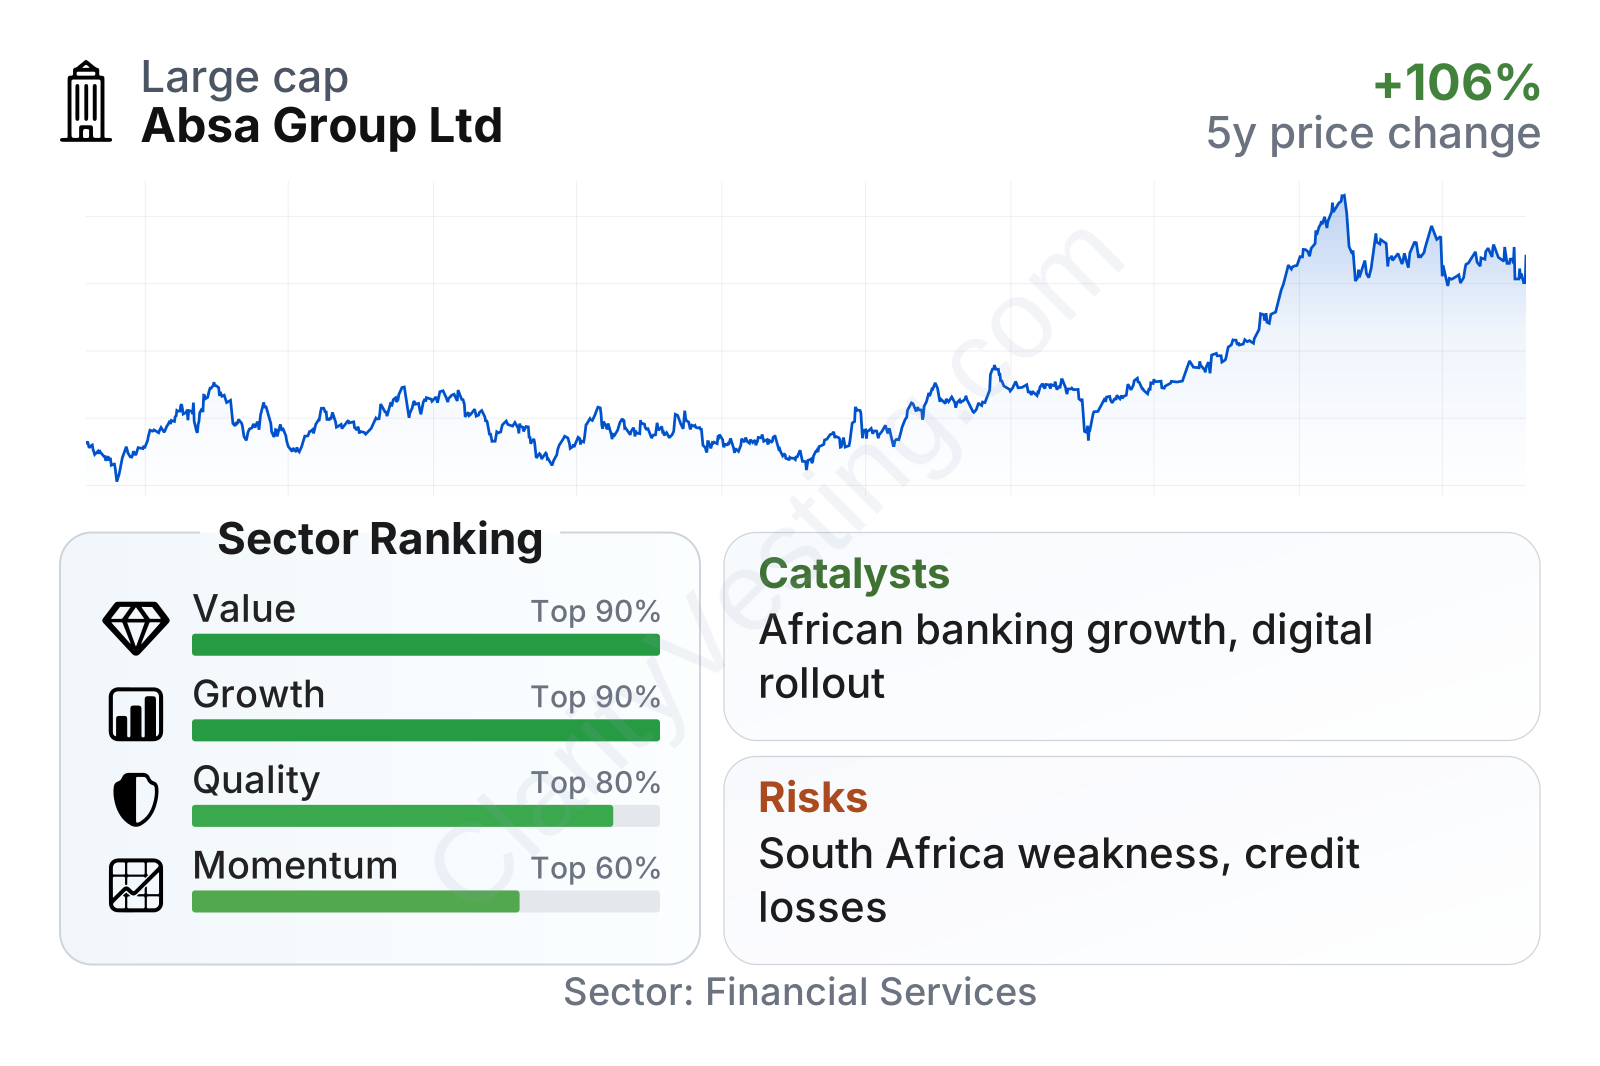
Absa stands out as a large regional bank with a market value in the large-cap range for its market and a relatively low share-price volatility. On valuation metrics, it screens cheaply versus the broader regional banking universe: its earnings multiple is below the sector median, its dividend yield is notably above the sector median, and its price-to-book ratio is far below typical banking peers. On profitability, return on equity and return on assets are stronger than sector medians, although margins are less impressive and leverage is naturally high, as expected in banking. Growth measures are mixed in the short run but much stronger over a five-year view, especially for earnings, free cash flow, and dividends per share.
The stock performance chart also points to a business that has regained market confidence over time. After a more uneven phase in 2023 and 2024, the share price moved to meaningfully higher levels into 2025 and 2026, suggesting that stronger earnings and improved sentiment have already started to be recognized.
Growth
Absa operates in a sector that should keep expanding over the long term: African banking. In many of its markets, formal banking penetration, credit access, digital payments, and wealth products remain underdeveloped compared with more mature economies. That creates room for growth in accounts, loans, cards, insurance, merchant acquiring, and mobile-led services. The opportunity is not just population growth; it also comes from the shift from cash and informal finance toward regulated banking platforms.
The company’s strategy broadly makes sense for that environment. It combines a strong home market in South Africa with a broader African footprint, which can help spread risk and create cross-border corporate banking opportunities. It has also continued investing in digital channels, which matters because digital adoption can lift customer retention, reduce branch dependency, and support fee income through payments and daily banking activity.
Earnings progression has been volatile in the shorter series shown, but the wider picture remains constructive. Five-year earnings-per-share growth is unusually strong relative to sector medians, which suggests that Absa has done more than simply benefit from one favorable year. For a bank, that matters because long-term earnings expansion tends to reflect a combination of loan growth, credit discipline, fee income, and capital management.
Book value per share has also moved upward over time. That is an important indicator for a bank because book value represents the equity base supporting lending and absorbing losses. The growth here is not explosive, but it is steady enough to indicate that Absa has been building shareholder capital while still distributing cash through dividends.
One of the clearest catalysts is the group’s exposure to structural financial deepening across Africa. A second is the possibility of better revenue mix from digital transactions, payments, and cross-border corporate business. A third is operational improvement: if Absa can keep revenue growing faster than costs, even modestly, profitability could strengthen from already solid levels.
Recent company communications have also highlighted ongoing business simplification, digital execution, and capital returns. None of that guarantees faster growth, but it does support the case that management is trying to improve efficiency and sharpen focus rather than merely defend the existing franchise.
Risks
This article is for informational purposes only and does not constitute financial advice. Some content is AI-generated. See Disclaimer


