Stock Analysis · White Mountains Insurance Group Ltd (WTM)
Overview
White Mountains Insurance Group Ltd is a Bermuda-based holding company that owns and develops insurance and insurance-related businesses. Rather than operating as a single traditional insurer, it works as a capital allocator: it buys, builds, and manages a collection of subsidiaries across property and casualty insurance, reinsurance, municipal bond insurance, and specialty distribution and services. The group is best known for combining conservative balance-sheet management with a willingness to invest in niche insurance operations where pricing or market structure looks favorable.
Its revenue mix can shift meaningfully from year to year because White Mountains owns multiple businesses and also records investment-related effects. Based on its latest annual reporting structure and recent results, the main economic contributors are broadly the following:
- Ark/Underwriting and reinsurance operations: approximately 45% to 55% of consolidated revenue in recent periods. This includes specialty property and casualty insurance and reinsurance written through Lloyd’s and other platforms.
- BAM (Build America Mutual): approximately 20% to 30%. BAM provides financial guaranty insurance, mainly backing U.S. municipal bonds, a business tied to public finance activity and insured par written.
- Kudu and other insurance-related operations: approximately 10% to 20%. These activities include asset-light businesses, distribution, MGA-related exposure, and investment stakes in firms that serve insurance markets.
- Investment income and other items: approximately 10% to 20%, though this can swing sharply with interest rates, market values, and realized or unrealized gains and losses.
That mix matters because White Mountains is not a plain premium-growth insurer. A meaningful part of the investment case comes from management’s ability to redeploy capital, grow book value over time, and benefit when specialty insurance pricing is disciplined.
The business flow over the past five years shows a sharp expansion in total revenue from a little above $600 million in 2021 to more than $2.7 billion in 2025, with profitability improving unevenly rather than in a straight line. That pattern fits the company’s model: reported earnings can be volatile, but the overall platform has become materially larger.
Key Figures
| Metric | Value | Sector ⓘ |
|---|---|---|
| Date | Oct 03, 2026 | |
| Context | ||
| Sector | Financial Services | |
| Industry | Insurance - Property & Casualty | |
| Market Cap ⓘ | $4.79B | |
| Beta ⓘ | 0.29 | |
Value (Cheapness) | ||
| P/E Ratio ⓘ | 4.60 | 12.60 |
| P/B Ratio ⓘ | 1.07 | 1.23 |
| FCF Yield ⓘ | 8.87% | 10.16% |
| Dividend Yield ⓘ | 0.05% | 2.96% |
| EBIT / EV ⓘ | 23.74% | 7.77% |
| PEG ⓘ | 0.81 | |
Growth (Business expansion) | ||
| Revenue Growth ⓘ | 22.50% | 9.50% |
| RPS Growth (5Y CAGR) ⓘ | 51.36% | 12.10% |
| EPS Growth (5Y CAGR) ⓘ | N/A | -9.45% |
| BVPS Growth (5Y CAGR) ⓘ | 11.45% | 5.01% |
| Margin Growth (5Y Trend) ⓘ | 93.17% | -4.07% |
| FCF Growth (5Y CAGR) ⓘ | N/A | 4.96% |
| DPS Growth (5Y CAGR) ⓘ | -0.02% | 8.79% |
Quality (Business durability) | ||
| ROIC (Latest) ⓘ | 20.68% | 9.60% |
| ROE (Latest) ⓘ | 26.45% | 13.84% |
| ROA (Latest) ⓘ | 8.56% | 1.53% |
| ROIC (5Y Median) ⓘ | 6.88% | 7.86% |
| ROE (5Y Median) ⓘ | 13.10% | 12.20% |
| ROA (5Y Median) ⓘ | 6.46% | 1.29% |
| Net Debt / EBIT (Latest) ⓘ | 0.60 | 0.91 |
| Net Debt / EBIT (5Y Median) ⓘ | 0.71 | 0.74 |
| Net Debt / EBITDA (Latest) ⓘ | 0.59 | 0.97 |
| Operating Margin (Latest) ⓘ | 49.69% | 22.12% |
| Operating Margin (5Y Median) ⓘ | 16.03% | 24.39% |
| Debt to Equity (Latest) ⓘ | 17.31% | 60.37% |
| Profit Margin (Latest) ⓘ | 37.66% | 26.62% |
| Free Cash Flow (Latest) ⓘ | $425.00M | |
Momentum (Price trend) | ||
| 3Y Return ⓘ | +33.57% | +89.23% |
| 12M Return (excl. last month) ⓘ | +14.74% | +17.35% |
| 6M Return ⓘ | -7.59% | +10.00% |
| Price vs. 200-Day MA ⓘ | -5.40% | +3.73% |
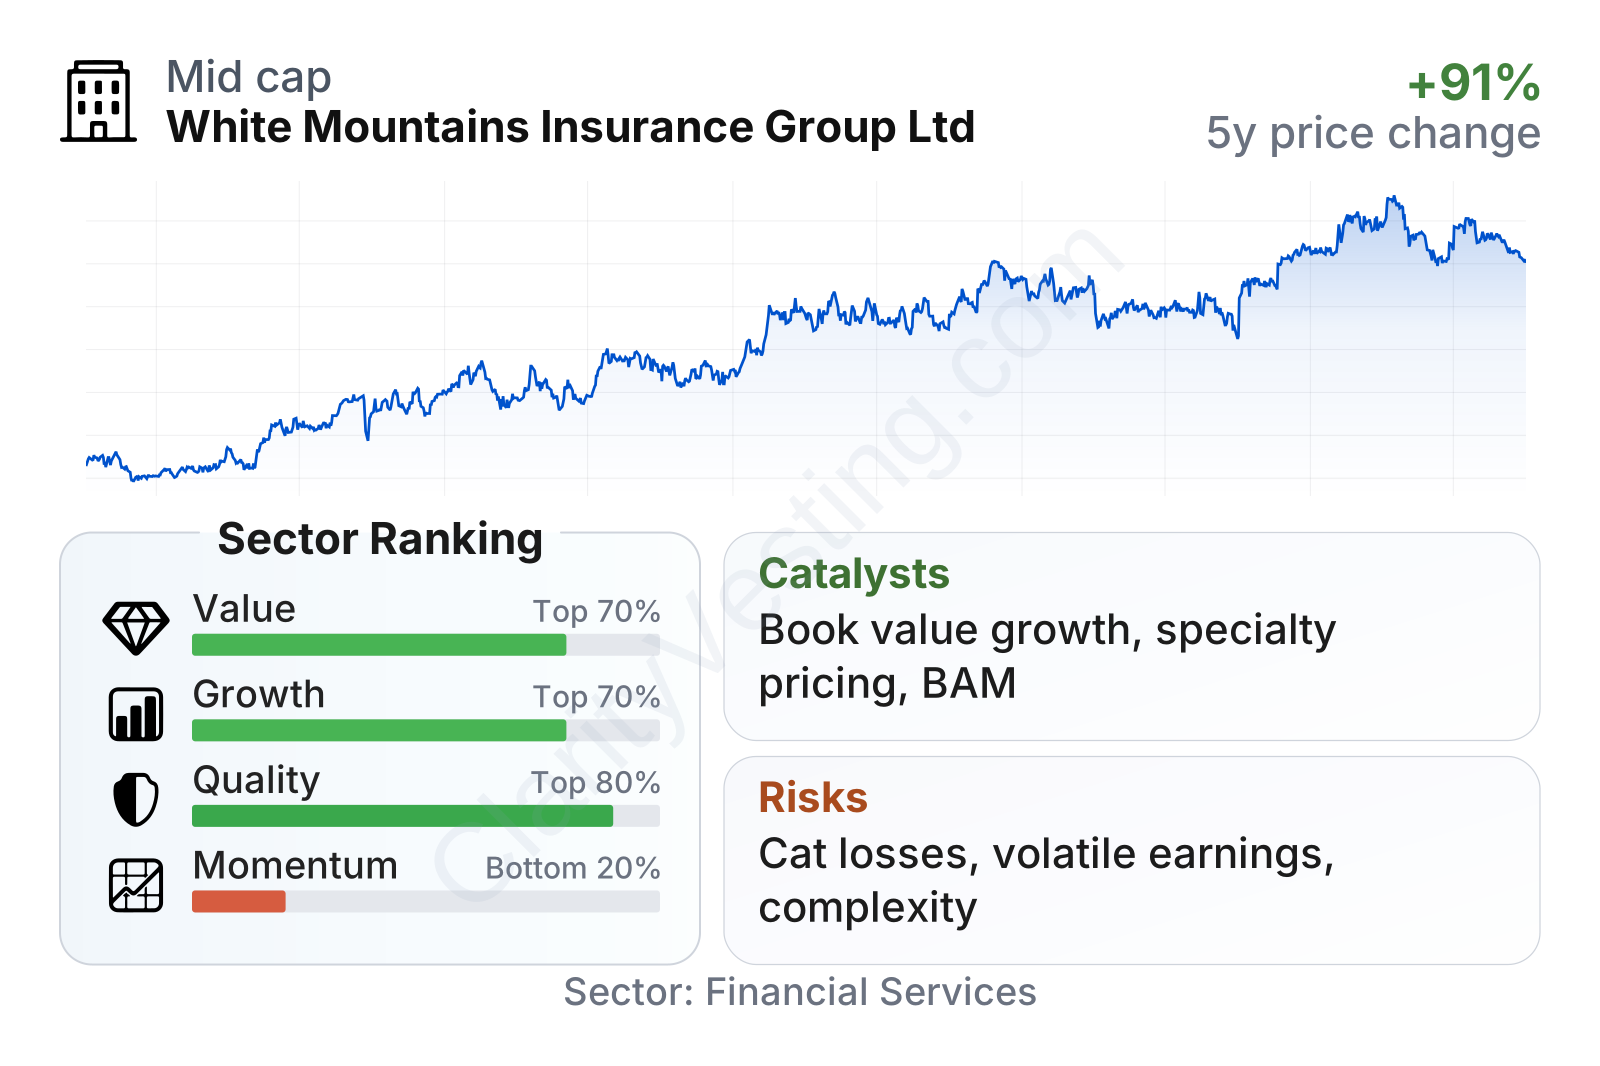
White Mountains is a mid-sized financial company with a stock that has historically moved less than the broader market, reflected in a low beta near 0.30. On valuation measures, the shares screen cheaper than many sector peers, with a low earnings multiple and a price-to-book ratio modestly below the sector median. Growth and quality indicators are also strong relative to peers: revenue growth, book value growth, margins, returns on equity, and returns on assets all compare well. The weaker area is recent share-price momentum, which has lagged much of the financial sector despite the stronger operating profile.
The share price trend since late 2021 has still been positive overall, climbing from roughly the low $1,000s to above $2,100 by mid-2026, although with visible swings along the way. That is consistent with a company whose intrinsic value tends to compound over time but whose reported results can fluctuate with insurance cycles and investment marks.
Growth
White Mountains operates in parts of insurance that remain structurally relevant for long-term growth. Specialty property and casualty insurance and reinsurance benefit from recurring demand, and after years of catastrophe losses and tighter capital, many lines have experienced firmer pricing. That environment tends to favor disciplined underwriters over volume-driven competitors. Municipal bond insurance is a narrower market, but it can still provide growth when public finance issuance improves and credit protection becomes more attractive to issuers and investors.
The company’s strategy also makes sense for long-term expansion because it is not dependent on a single engine. Management can grow existing subsidiaries, make acquisitions, seed new ventures, or add minority investments in insurance-related businesses. This gives White Mountains multiple ways to compound value even if one segment slows. The approach is especially useful in insurance, where the best opportunities often appear cyclically rather than continuously.
Earnings per share illustrate both the attraction and the complication of the business. Results have been highly uneven, moving from a loss in 2021 to very strong profitability in 2022 and 2025, with weaker periods in between. For a long-term reader, that suggests focusing less on one-year earnings and more on whether capital is being deployed into businesses that can produce higher normalized returns over time.
Book value per share is often one of the most useful yardsticks for an insurance holding company, and here the direction has been favorable. It rose from roughly $1,166 at the end of 2021 to about $1,799 by the end of 2025, despite a setback in 2024. That supports the idea that the company has been adding net worth per share over a multi-year period, not just producing one-off accounting gains.
A recent positive signal is the combination of strong trailing profitability and relatively modest leverage. White Mountains generated about $425 million in free cash flow on a trailing basis, while debt metrics remained lighter than the sector median. This leaves room for further acquisitions, internal investment, or opportunistic capital deployment if insurance market conditions stay favorable.
Risks
This article is for informational purposes only and does not constitute financial advice. Some content is AI-generated. See Disclaimer