Stock Analysis · Progressive Corp (PGR)
Overview
Progressive is a large U.S. property and casualty insurer best known for auto insurance, but its business is broader than that. The company writes policies for personal vehicles, commercial vehicles, homeowners and other property risks, and it also earns income by investing the premium float it holds before claims are paid. Its model combines pricing discipline, heavy use of data, broad distribution through both direct and independent agency channels, and a large claims operation designed to keep service fast and costs under control.
For long-term analysis, the most important point is that Progressive is still primarily an auto insurer. Based on the company’s segment reporting in recent annual filings, revenue is centered on net premiums earned, with investment income as a smaller but meaningful contributor. Within insurance operations, personal lines remains the dominant earnings engine.
- Personal Lines: approximately 75% to 80% of net premiums written. This mainly includes personal auto insurance and also residential property products sold to households.
- Commercial Lines: approximately 15% to 20% of net premiums written. This covers auto-related insurance for small businesses, contractors, transportation operators, and fleet customers.
- Property: approximately 5% to 10% of net premiums written as a stand-alone segment disclosure, largely homeowners and related products. Some of this is also discussed within personal lines context depending on the filing presentation.
- Investment income: typically a single-digit percentage of total revenue, but still important because insurers invest large bond and equity portfolios built from collected premiums.
Over the past several years, Progressive’s revenue and profit flow expanded sharply. Total revenue rose from about $48 billion in 2021 to nearly $88 billion in 2025, while net income increased from about $3.4 billion to more than $11 billion. That pattern suggests not only premium growth, but also a major improvement in underwriting profitability after a weaker 2022.
The business mix shows a company that has become much larger while keeping financing needs relatively modest. Interest expense stayed small compared with operating income, and the rebound from 2022 to 2025 was especially strong, indicating that pricing and claims trends moved back in the company’s favor.
Key Figures
| Metric | Value | Sector ⓘ |
|---|---|---|
| Date | Oct 19, 2026 | |
| Context | ||
| Sector | Financial Services | |
| Industry | Insurance - Property & Casualty | |
| Market Cap ⓘ | $126.81B | |
| Beta ⓘ | 0.23 | |
Value (Cheapness) | ||
| P/E Ratio ⓘ | 11.01 | 12.26 |
| P/B Ratio ⓘ | 3.69 | 1.23 |
| FCF Yield ⓘ | 12.58% | 10.40% |
| Dividend Yield ⓘ | 0.05% | 3.02% |
| EBIT / EV ⓘ | 11.75% | 8.14% |
| PEG ⓘ | 63.46 | |
Growth (Business expansion) | ||
| Revenue Growth ⓘ | 3.00% | 9.25% |
| RPS Growth (5Y CAGR) ⓘ | 16.38% | 12.19% |
| EPS Growth (5Y CAGR) ⓘ | 40.96% | -9.36% |
| BVPS Growth (5Y CAGR) ⓘ | 14.29% | 4.99% |
| Margin Growth (5Y Trend) ⓘ | 7.26% | -3.86% |
| FCF Growth (5Y CAGR) ⓘ | 22.99% | 4.81% |
| DPS Growth (5Y CAGR) ⓘ | -6.65% | 8.79% |
Quality (Business durability) | ||
| ROIC (Latest) ⓘ | 29.33% | 9.49% |
| ROE (Latest) ⓘ | 35.87% | 13.87% |
| ROA (Latest) ⓘ | 9.27% | 1.54% |
| ROIC (5Y Median) ⓘ | 26.27% | 7.86% |
| ROE (5Y Median) ⓘ | 21.37% | 12.17% |
| ROA (5Y Median) ⓘ | 4.96% | 1.30% |
| Net Debt / EBIT (Latest) ⓘ | 0.56 | 0.99 |
| Net Debt / EBIT (5Y Median) ⓘ | 1.06 | 0.73 |
| Net Debt / EBITDA (Latest) ⓘ | 0.55 | 0.91 |
| Operating Margin (Latest) ⓘ | 16.56% | 22.30% |
| Operating Margin (5Y Median) ⓘ | 9.29% | 24.63% |
| Debt to Equity (Latest) ⓘ | 24.33% | 58.04% |
| Profit Margin (Latest) ⓘ | 12.67% | 26.57% |
| Free Cash Flow (Latest) ⓘ | $15.95B | |
Momentum (Price trend) | ||
| 3Y Return ⓘ | +50.35% | +88.26% |
| 12M Return (excl. last month) ⓘ | -5.67% | +19.24% |
| 6M Return ⓘ | +7.48% | +4.70% |
| Price vs. 200-Day MA ⓘ | +4.86% | +3.66% |
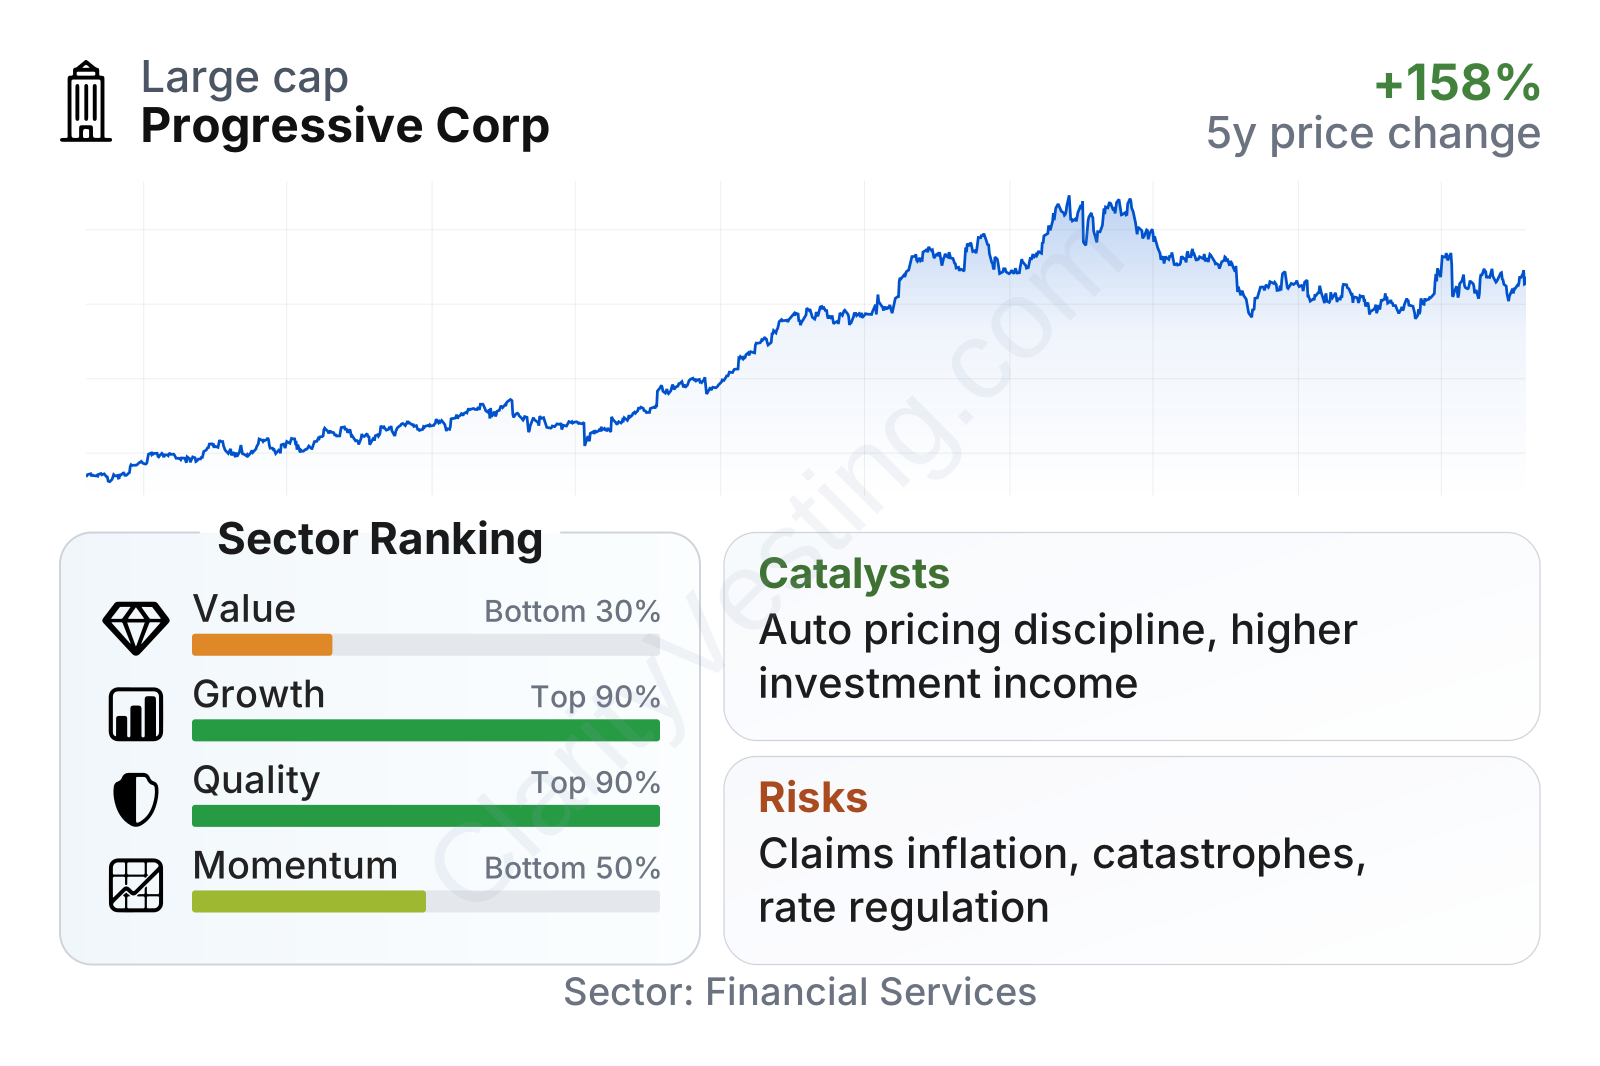
Progressive stands out for business quality and long-term growth more than for classic cheapness. On value measures, the picture is mixed: the earnings multiple is not far from the sector median, but the price-to-book ratio remains far above most financial companies. That premium reflects unusually strong profitability rather than a distressed or asset-heavy balance sheet. Growth and quality rank near the top of the sector, helped by strong multi-year expansion in earnings, book value per share, and free cash flow. Recent share-price momentum has been more moderate, which suggests the stock has paused after a very strong run rather than continuing in a straight line upward.
The stock history also shows that Progressive’s market value rose dramatically from 2021 through 2025, followed by a more uneven period in 2025 and 2026. That is common for insurers after a phase of exceptional underwriting results, as the market starts asking whether margins are near a high point.
Growth
Property and casualty insurance is not a flashy sector, but it is a durable one. Auto coverage is legally required in most U.S. states, and commercial auto is essential for many businesses. That creates recurring demand. Over time, the industry can grow through more insured vehicles, higher insured values, premium rate increases, and new products. Progressive is well positioned because it has scale in a market where data, pricing accuracy, and claims efficiency matter a great deal.
The company’s strategy for future expansion is sensible. Progressive has long invested in telematics, direct-to-consumer marketing, analytics, and pricing segmentation. In plain language, it tries to price policies more precisely than competitors and win customers where it believes the risk-adjusted return is attractive. That approach is especially useful in auto insurance, where claims costs can change quickly because of repair inflation, medical costs, accident frequency, and weather events. A carrier that reacts faster can protect margins better.
Another growth driver is distribution breadth. Progressive is strong both in direct sales and through independent agents, which reduces dependence on a single channel. It also has room to deepen customer relationships by bundling auto and home-related coverage, and commercial lines offers a second leg of growth outside the personal auto market.
Earnings per share climbed sharply over the last several years, especially after 2023. That matters because it suggests growth was not just coming from writing more policies, but from writing them more profitably. The company’s five-year earnings growth is far ahead of the sector median, which is one reason the market gives Progressive a premium valuation.
Book value per share has also risen at a strong pace, with a temporary setback in 2022 followed by a powerful recovery. For an insurer, book value growth is a useful marker because it reflects retained earnings and capital accumulation over time. Progressive’s track record here supports the idea that the company has been compounding its financial base, not merely benefiting from a short-lived earnings spike.
A current catalyst is the combination of disciplined pricing and ongoing scale advantages in auto insurance. If loss costs remain manageable and the company continues to add policies in force, future premium growth can translate efficiently into earnings. Higher investment income from the insurer’s bond portfolio also remains a supporting factor as long as interest rates stay above the very low levels seen earlier in the decade.
Risks
This article is for informational purposes only and does not constitute financial advice. Some content is AI-generated. See Disclaimer


