Stock Analysis · Standard Bank Group Ltd PK (SGBLY)
Overview
Standard Bank Group is one of the largest banking groups in Africa. Headquartered in South Africa, it provides everyday banking, lending, payments, savings, insurance, investment products, and corporate banking services. Its customer base spans personal clients, small businesses, large companies, institutions, and public-sector entities. The group also has a meaningful presence outside South Africa through operations in other African countries and selected international hubs that support trade, capital flows, and cross-border banking.
The business is broadly organized around retail and business banking, corporate and investment banking, and insurance and asset management activities. In simple terms, it earns money from the spread between the interest it receives on loans and the interest it pays on deposits and funding, from fees charged for banking services, and from a mix of trading, insurance, and wealth-related income.
Based on the group’s recent reporting structure, the main sources of revenue are approximately the following:
- Net interest income: about 50% to 60% of total banking revenue. This is the income from home loans, vehicle finance, corporate lending, overdrafts, credit cards, and other lending activities after funding costs.
- Non-interest revenue from fees and commissions: about 20% to 30%. This includes transaction fees, card and payments income, account fees, advisory-related fees, and service charges.
- Trading, principal transactions, and other market-related income: about 10% to 20%. This comes mainly from foreign exchange, fixed income, commodities, and client-driven market activity.
- Insurance and asset management-related earnings: generally a smaller but still meaningful share of group profit, supported by life insurance, short-term insurance, savings, and investment products.
The revenue mix matters because it shows Standard Bank is not dependent on one single banking line. It combines traditional lending with payments, corporate banking, markets activity, and insurance-linked earnings. Over the last several years, total revenue and operating income have moved materially higher, while net income has remained resilient at a high level, which points to a business with both scale and diversification.
The long-term direction is constructive: revenue has expanded strongly since 2021, and profitability has broadly kept pace even as funding costs and operating expenses moved around. That combination suggests the group has been able to defend margins reasonably well in a volatile operating environment.
Key Figures
| Metric | Value | Sector ⓘ |
|---|---|---|
| Date | Oct 17, 2026 | |
| Context | ||
| Sector | Financial Services | |
| Industry | Banks - Regional | |
| Market Cap ⓘ | $29.67B | |
| Beta ⓘ | 0.37 | |
Value (Cheapness) | ||
| P/E Ratio ⓘ | 9.90 | 12.26 |
| P/B Ratio ⓘ | 0.11 | 1.23 |
| FCF Yield ⓘ | -145.38% | 10.40% |
| Dividend Yield ⓘ | 5.90% | 3.02% |
| EBIT / EV ⓘ | N/A | 8.14% |
| PEG ⓘ | N/A | |
Growth (Business expansion) | ||
| Revenue Growth ⓘ | 6.10% | 9.35% |
| RPS Growth (5Y CAGR) ⓘ | 24.26% | 12.19% |
| EPS Growth (5Y CAGR) ⓘ | 46.38% | -9.53% |
| BVPS Growth (5Y CAGR) ⓘ | 2.92% | 4.99% |
| Margin Growth (5Y Trend) ⓘ | -6.39% | -3.86% |
| FCF Growth (5Y CAGR) ⓘ | 67.97% | 4.81% |
| DPS Growth (5Y CAGR) ⓘ | 23.18% | 8.79% |
Quality (Business durability) | ||
| ROIC (Latest) ⓘ | -10.27% | 9.49% |
| ROE (Latest) ⓘ | 37.46% | 13.90% |
| ROA (Latest) ⓘ | 2.84% | 1.55% |
| ROIC (5Y Median) ⓘ | 12.75% | 7.86% |
| ROE (5Y Median) ⓘ | 18.31% | 12.17% |
| ROA (5Y Median) ⓘ | 1.38% | 1.30% |
| Net Debt / EBIT (Latest) ⓘ | N/A | 0.96 |
| Net Debt / EBIT (5Y Median) ⓘ | -0.07 | 0.73 |
| Net Debt / EBITDA (Latest) ⓘ | N/A | 0.92 |
| Operating Margin (Latest) ⓘ | -10.45% | 22.30% |
| Operating Margin (5Y Median) ⓘ | 35.73% | 24.63% |
| Debt to Equity (Latest) ⓘ | 107.35% | 58.56% |
| Profit Margin (Latest) ⓘ | 28.87% | 26.57% |
| Free Cash Flow (Latest) ⓘ | -$43.13B | |
Momentum (Price trend) | ||
| 3Y Return ⓘ | +129.68% | +88.33% |
| 12M Return (excl. last month) ⓘ | +49.39% | +19.38% |
| 6M Return ⓘ | +0.89% | +4.75% |
| Price vs. 200-Day MA ⓘ | +1.83% | +3.50% |
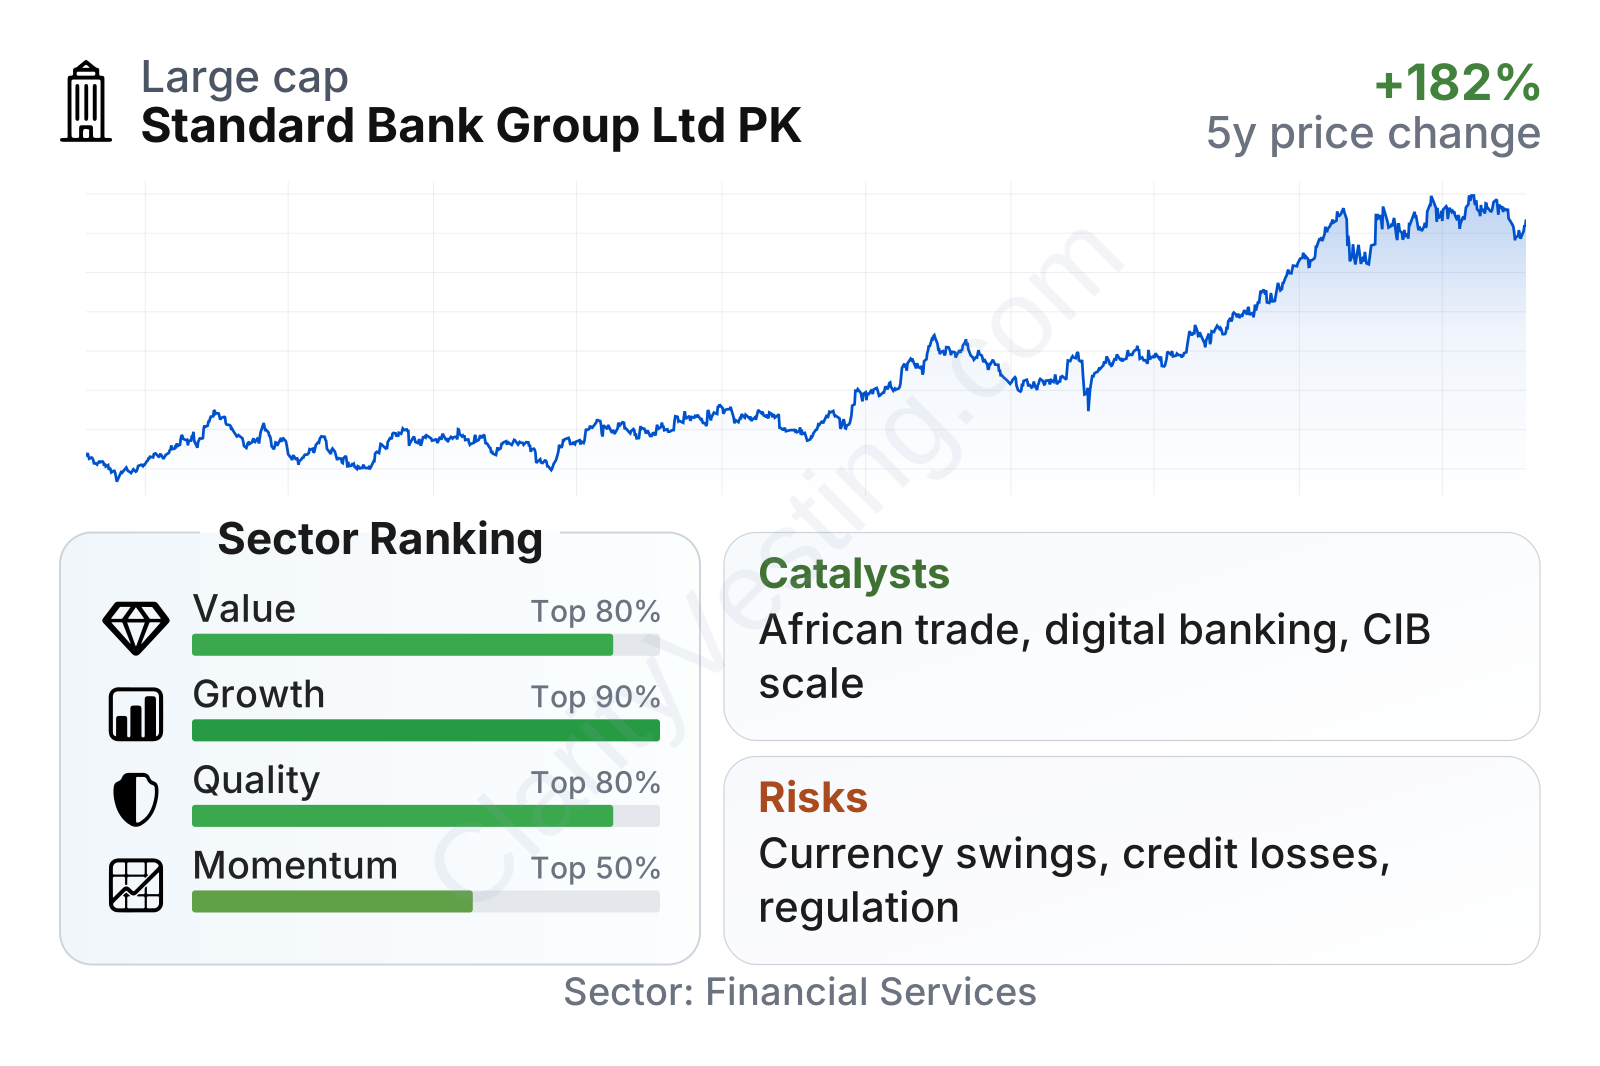
Standard Bank stands out as a large regional bank with a low share-price volatility profile and a value profile that looks unusually cheap relative to the broader regional banking universe. The table also points to a strong quality and growth ranking versus peers, helped by high returns on equity and assets, solid multi-year earnings expansion, and fast dividend growth. The weaker spots are slower recent revenue growth than the sector median, softer recent share-price momentum than the strongest names, and negative trailing free cash flow, which is common to interpret cautiously for banks because cash flow measures often do not reflect banking economics as cleanly as they do for industrial companies.
Growth
Standard Bank operates in a part of the financial sector that still has structural room to expand. Banking penetration, formal savings, digital payments, consumer finance, small-business services, and cross-border trade finance remain underdeveloped in many African markets compared with more mature economies. That creates a long runway for deposit gathering, lending, transaction banking, and digital financial services.
The company’s strategy is aligned with that opportunity. Its scale in South Africa gives it a strong base, while its wider African network positions it to serve companies and consumers connected to trade, infrastructure, energy, mining, and rising intra-African commerce. This is important because many multinational and regional clients prefer banks that can operate across several countries instead of just one. Standard Bank’s corporate and investment banking arm is particularly relevant here, since it can connect financing, foreign exchange, risk management, and transaction services.
Digitalization is another growth lever. Large banks that already have branch networks, customer data, payment rails, and trusted brands can use mobile and online banking to raise engagement while reducing the cost of serving each customer over time. In emerging markets, digital channels also help bring more activity into the formal banking system, which can support fee income and deposits.
Earnings per share have continued to trend upward into the latest reported period, reinforcing the broader picture from the last five years: profit growth has been materially stronger than the sector median. That does not guarantee a straight line from here, but it does show that the group has recently converted revenue growth into stronger shareholder earnings.
Book value per share has also climbed over time, although the most recent movement appears flatter than the earlier trend. For banks, book value is a useful anchor because it reflects the capital base that supports lending and other activities. A rising book value over several years usually indicates retained earnings and balance-sheet expansion, both of which matter for future capacity to grow.
A practical catalyst is the company’s exposure to higher-value corporate banking themes across Africa, including energy, infrastructure, trade corridors, and capital market activity. Another is the ongoing shift from cash to digital payments, which can lift fee income and customer retention. Standard Bank’s broad geographic footprint also creates room to benefit if economic conditions improve unevenly across African markets, since strength in one region can partially offset weakness in another.
Risks
This article is for informational purposes only and does not constitute financial advice. Some content is AI-generated. See Disclaimer


