Stock Analysis · ASA Gold and Precious Metals Ltd (ASA)
Overview
ASA Gold and Precious Metals Ltd is a closed-end investment company focused on the precious-metals space. Rather than operating mines itself, it invests primarily in publicly listed companies involved in gold, silver, platinum, diamonds, and other mineral activities. In practice, ASA gives shareholders exposure to a portfolio of mining and royalty businesses, with results that are heavily influenced by changes in commodity prices, mining-company valuations, and portfolio management decisions.
Its economic model is different from a traditional operating company. Revenue and earnings mostly come from investment results rather than selling products or services. Based on its public filings, the main sources are:
- Net realized and unrealized gains on investments: historically the dominant driver in strong years, coming from changes in the market value of the portfolio and gains when holdings are sold.
- Dividend and interest income from portfolio holdings: a smaller but recurring source tied to distributions from mining and royalty companies and income on cash or short-term investments.
- Other income: limited and not a major contributor compared with portfolio gains and investment income.
Because ASA is an investment fund, precise revenue mix percentages can swing dramatically from year to year. In weak commodity markets, valuation losses can overwhelm income; in strong markets, investment gains can account for well over 80% of annual results. Operating costs are comparatively modest, consisting mainly of management, custody, administration, and other fund-level expenses.
The recent financial flow pattern shows how sensitive the business is to market conditions. After a deep loss period in 2022, profitability improved sharply in 2024 and expanded again in 2025, while operating expenses remained relatively small compared with portfolio-driven gains. That structure means upside can be powerful when precious-metals equities rally, but it also makes results inherently volatile.
Key Figures
| Metric | Value | Sector ⓘ |
|---|---|---|
| Date | Oct 17, 2026 | |
| Context | ||
| Sector | Financial Services | |
| Industry | Asset Management | |
| Market Cap ⓘ | $1.01B | |
| Beta ⓘ | 0.77 | |
Value (Cheapness) | ||
| P/E Ratio ⓘ | 1.42 | 12.26 |
| P/B Ratio ⓘ | 0.76 | 1.23 |
| FCF Yield ⓘ | 13.05% | 10.40% |
| Dividend Yield ⓘ | 0.12% | 3.02% |
| EBIT / EV ⓘ | N/A | 8.14% |
| PEG ⓘ | N/A | |
Growth (Business expansion) | ||
| Revenue Growth ⓘ | 243.00% | 9.35% |
| RPS Growth (5Y CAGR) ⓘ | 67.50% | 12.19% |
| EPS Growth (5Y CAGR) ⓘ | 26.82% | -9.53% |
| BVPS Growth (5Y CAGR) ⓘ | 23.76% | 4.99% |
| Margin Growth (5Y Trend) ⓘ | 356.91% | -3.86% |
| FCF Growth (5Y CAGR) ⓘ | N/A | 4.81% |
| DPS Growth (5Y CAGR) ⓘ | -15.84% | 8.79% |
Quality (Business durability) | ||
| ROIC (Latest) ⓘ | N/A | 9.49% |
| ROE (Latest) ⓘ | 92.34% | 13.90% |
| ROA (Latest) ⓘ | 91.50% | 1.55% |
| ROIC (5Y Median) ⓘ | N/A | 7.86% |
| ROE (5Y Median) ⓘ | 3.88% | 12.17% |
| ROA (5Y Median) ⓘ | 3.87% | 1.30% |
| Net Debt / EBIT (Latest) ⓘ | N/A | 0.96 |
| Net Debt / EBIT (5Y Median) ⓘ | -0.01 | 0.73 |
| Net Debt / EBITDA (Latest) ⓘ | N/A | 0.92 |
| Operating Margin (Latest) ⓘ | N/A | 22.30% |
| Operating Margin (5Y Median) ⓘ | 100.76% | 24.63% |
| Debt to Equity (Latest) ⓘ | N/A | 58.56% |
| Profit Margin (Latest) ⓘ | 10508.00% | 26.57% |
| Free Cash Flow (Latest) ⓘ | $131.28M | |
Momentum (Price trend) | ||
| 3Y Return ⓘ | +325.26% | +88.33% |
| 12M Return (excl. last month) ⓘ | +53.76% | +19.38% |
| 6M Return ⓘ | -14.18% | +4.75% |
| Price vs. 200-Day MA ⓘ | -9.85% | +3.50% |
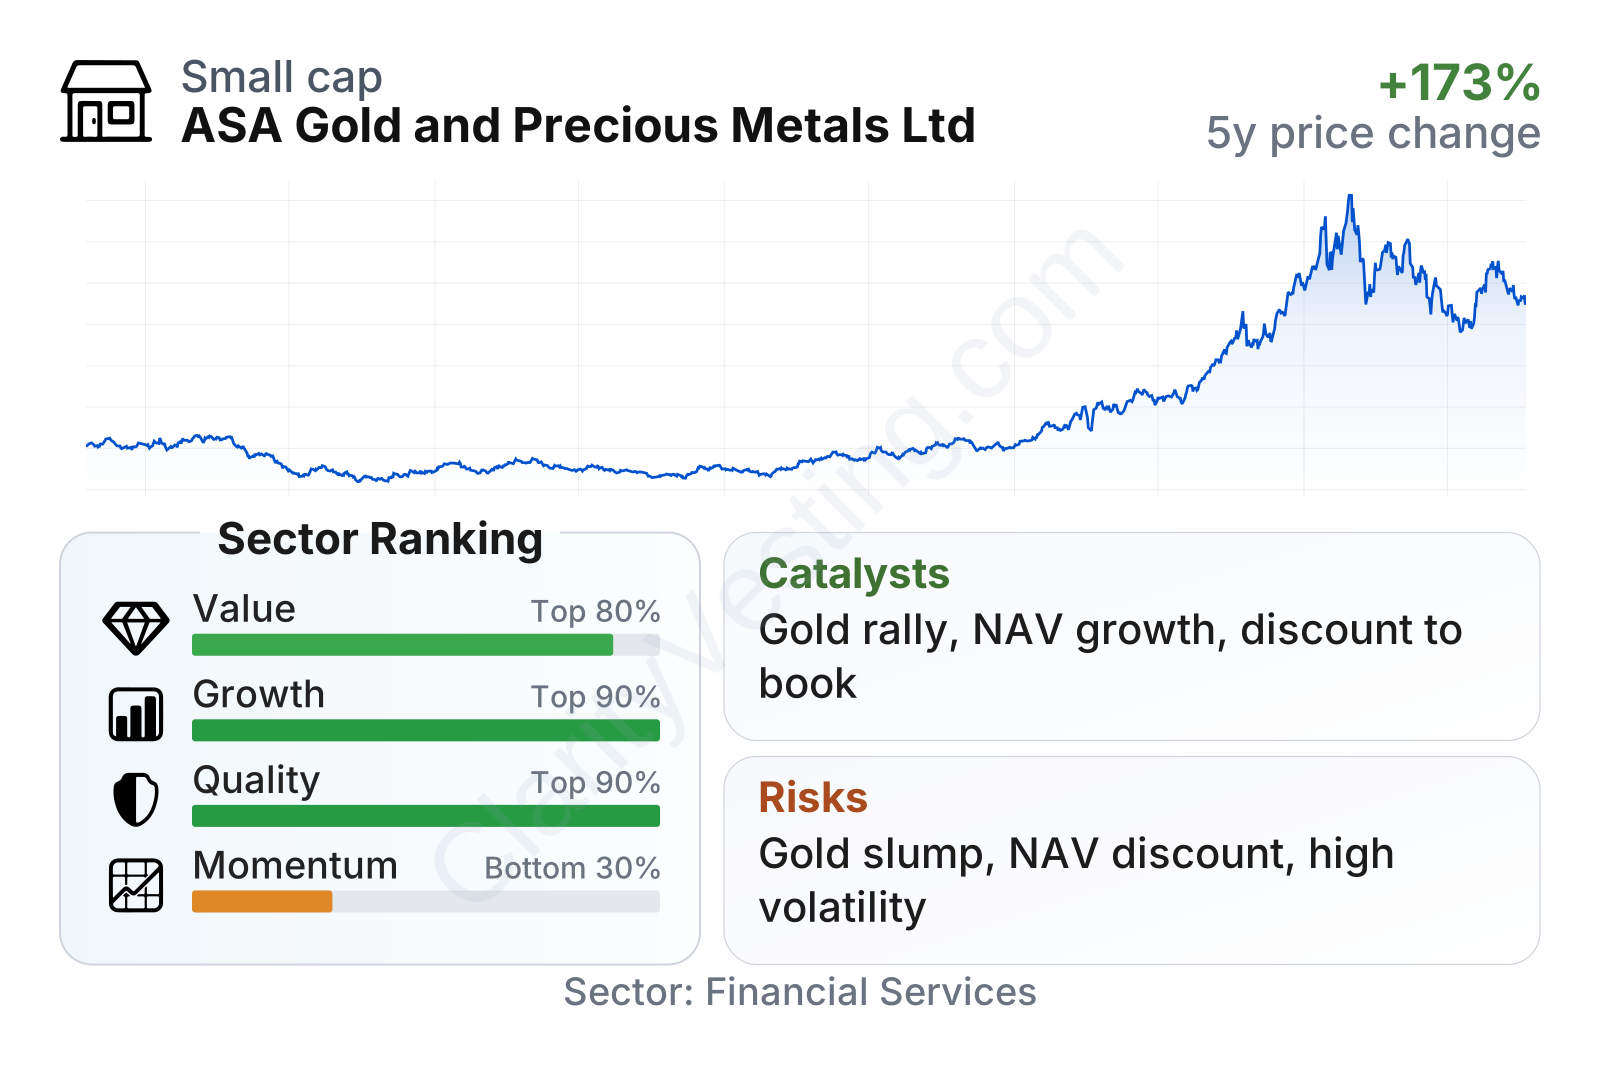
ASA is a mid-sized closed-end fund with a market value around $1 billion and a beta below 0.8, suggesting share-price moves have not been as broad-market-sensitive as many equities. The stock had a very strong multi-year run, especially through 2025 and early 2026, although the last several months show a meaningful pullback from recent highs.
The metrics table points to an unusual combination: very strong growth and quality readings, but weaker recent momentum. Value indicators also look inexpensive relative to much of the financial sector, with a price-to-book ratio below the sector median. That said, these ratios need to be read carefully because ASA’s earnings can surge or collapse based on portfolio gains, making headline valuation figures look unusually low at cycle peaks.
Growth
ASA operates in a niche that can benefit from long-term demand for gold and precious metals as stores of value, inflation hedges, and reserve assets. The sector is not a steady growth market in the way software or health care can be, but it can go through long and powerful upcycles when gold prices rise, real interest rates fall, central banks add gold reserves, or geopolitical uncertainty increases. That backdrop can create favorable conditions for mining equities and, by extension, for ASA’s portfolio.
Its strategy is straightforward and understandable: concentrate capital in precious-metals businesses and let investors access the segment through a single listed vehicle. The approach can make sense for future growth if management continues to allocate well across producers, developers, and related companies. In this area, stock selection matters a lot because mining companies are not all equal: costs, reserve quality, jurisdiction, and balance-sheet strength can lead to very different outcomes even when metal prices move in the same direction.
Earnings progression illustrates both the opportunity and the cyclicality. After a sharp loss period, earnings recovered and then accelerated dramatically in the latest reported period. That rebound reflects a much stronger environment for the portfolio rather than a linear operating expansion. For long-term readers, the more useful takeaway is that ASA can translate a favorable metals cycle into very large profit swings.
Book value per share has also risen sharply over the last reported periods after earlier weakness. For a fund like ASA, book value is especially important because it approximates the underlying net asset value created by the investment portfolio. A strong climb here usually indicates the portfolio has appreciated meaningfully and that the company has rebuilt value after the downturn seen in 2022.
A notable catalyst is the broader strength in gold-related assets over the last two years. When bullion prices remain elevated, miners often receive expanding cash flow and stronger balance sheets, which can lift equity valuations. In turn, a fund such as ASA can benefit not only from commodity strength itself but also from a rerating of the underlying holdings. Recent performance trends suggest that this mechanism has already been at work.
Risks
This article is for informational purposes only and does not constitute financial advice. Some content is AI-generated. See Disclaimer


