Stock Analysis · Andersen Group Inc (ANDG)
Overview
Andersen Group Inc operates in the personal services segment of the consumer cyclical sector. Based on its recent SEC filings, the company is primarily a provider of automotive and transportation-related services, with activity centered on vehicle logistics, inspection, claims, and related support work. In simple terms, it helps move, manage, inspect, and process vehicles and transportation assets for commercial customers.
The business appears to generate most of its revenue from service activity rather than product sales, which makes operating execution, labor management, and customer volumes especially important. The latest annual figures also show that revenue kept expanding through 2025, but profitability deteriorated sharply, suggesting that growth alone did not translate into stronger earnings.
Public filings do not provide a sufficiently clear 2026 revenue split by service line to present a reliable percentage breakdown without overreaching. What is clear is that the company’s revenue base is tied mainly to fee-based services connected to transportation operations and customer support programs, rather than to a broad set of unrelated businesses.
The income flow over the last three annual periods shows a notable shift: sales rose from roughly $639 million in 2023 to about $839 million in 2025, but operating income moved from a strong profit in 2023 and 2024 to a large operating loss in 2025. That change points to cost pressure, integration or execution issues, or a business mix shift that weakened margins even as volume increased.
The revenue trend has been solid, but the cost structure became much heavier in 2025. Cost of revenue and operating expenses absorbed a much larger share of sales, which explains why a growing top line turned into negative operating income.
Key Figures
| Metric | Value | Sector ⓘ |
|---|---|---|
| Date | Oct 17, 2026 | |
| Context | ||
| Sector | Consumer Cyclical | |
| Industry | Personal Services | |
| Market Cap ⓘ | $1.07B | |
| Beta ⓘ | N/A | |
Value (Cheapness) | ||
| P/E Ratio ⓘ | 19.09 | 16.89 |
| P/B Ratio ⓘ | N/A | 1.61 |
| FCF Yield ⓘ | 15.69% | 8.99% |
| Dividend Yield ⓘ | N/A | 2.73% |
| EBIT / EV ⓘ | -4.82% | 6.69% |
| PEG ⓘ | N/A | |
Growth (Business expansion) | ||
| Revenue Growth ⓘ | 23.70% | 5.60% |
| RPS Growth (5Y CAGR) ⓘ | 14.54% | 8.91% |
| EPS Growth (5Y CAGR) ⓘ | N/A | -17.41% |
| BVPS Growth (5Y CAGR) ⓘ | N/A | 5.62% |
| Margin Growth (5Y Trend) ⓘ | -33.94% | -0.17% |
| FCF Growth (5Y CAGR) ⓘ | 23.82% | 4.91% |
| DPS Growth (5Y CAGR) ⓘ | 53.23% | 9.86% |
Quality (Business durability) | ||
| ROIC (Latest) ⓘ | N/A | 12.38% |
| ROA (Latest) ⓘ | 7.50% | 5.49% |
| ROIC (5Y Median) ⓘ | N/A | 10.75% |
| ROA (5Y Median) ⓘ | N/A | 5.44% |
| Net Debt / EBIT (Latest) ⓘ | N/A | 2.17 |
| Net Debt / EBIT (5Y Median) ⓘ | N/A | 2.30 |
| Net Debt / EBITDA (Latest) ⓘ | N/A | 1.50 |
| Net Debt / Assets ⓘ | 41.78% | 21.57% |
| EBITDA / Interest ⓘ | N/A | 9.13 |
| Operating Margin (Latest) ⓘ | -6.46% | 9.10% |
| Operating Margin (5Y Median) ⓘ | 18.76% | 9.56% |
| Debt to Equity (Latest) ⓘ | -53.45% | 75.99% |
| Profit Margin (Latest) ⓘ | 4.66% | 5.31% |
| Free Cash Flow (Latest) ⓘ | $167.78M | |
Momentum (Price trend) | ||
| 3Y Return ⓘ | N/A | +15.94% |
| 12M Return (excl. last month) ⓘ | N/A | -2.82% |
| 6M Return ⓘ | +98.90% | -1.58% |
| Price vs. 200-Day MA ⓘ | +57.72% | -3.31% |
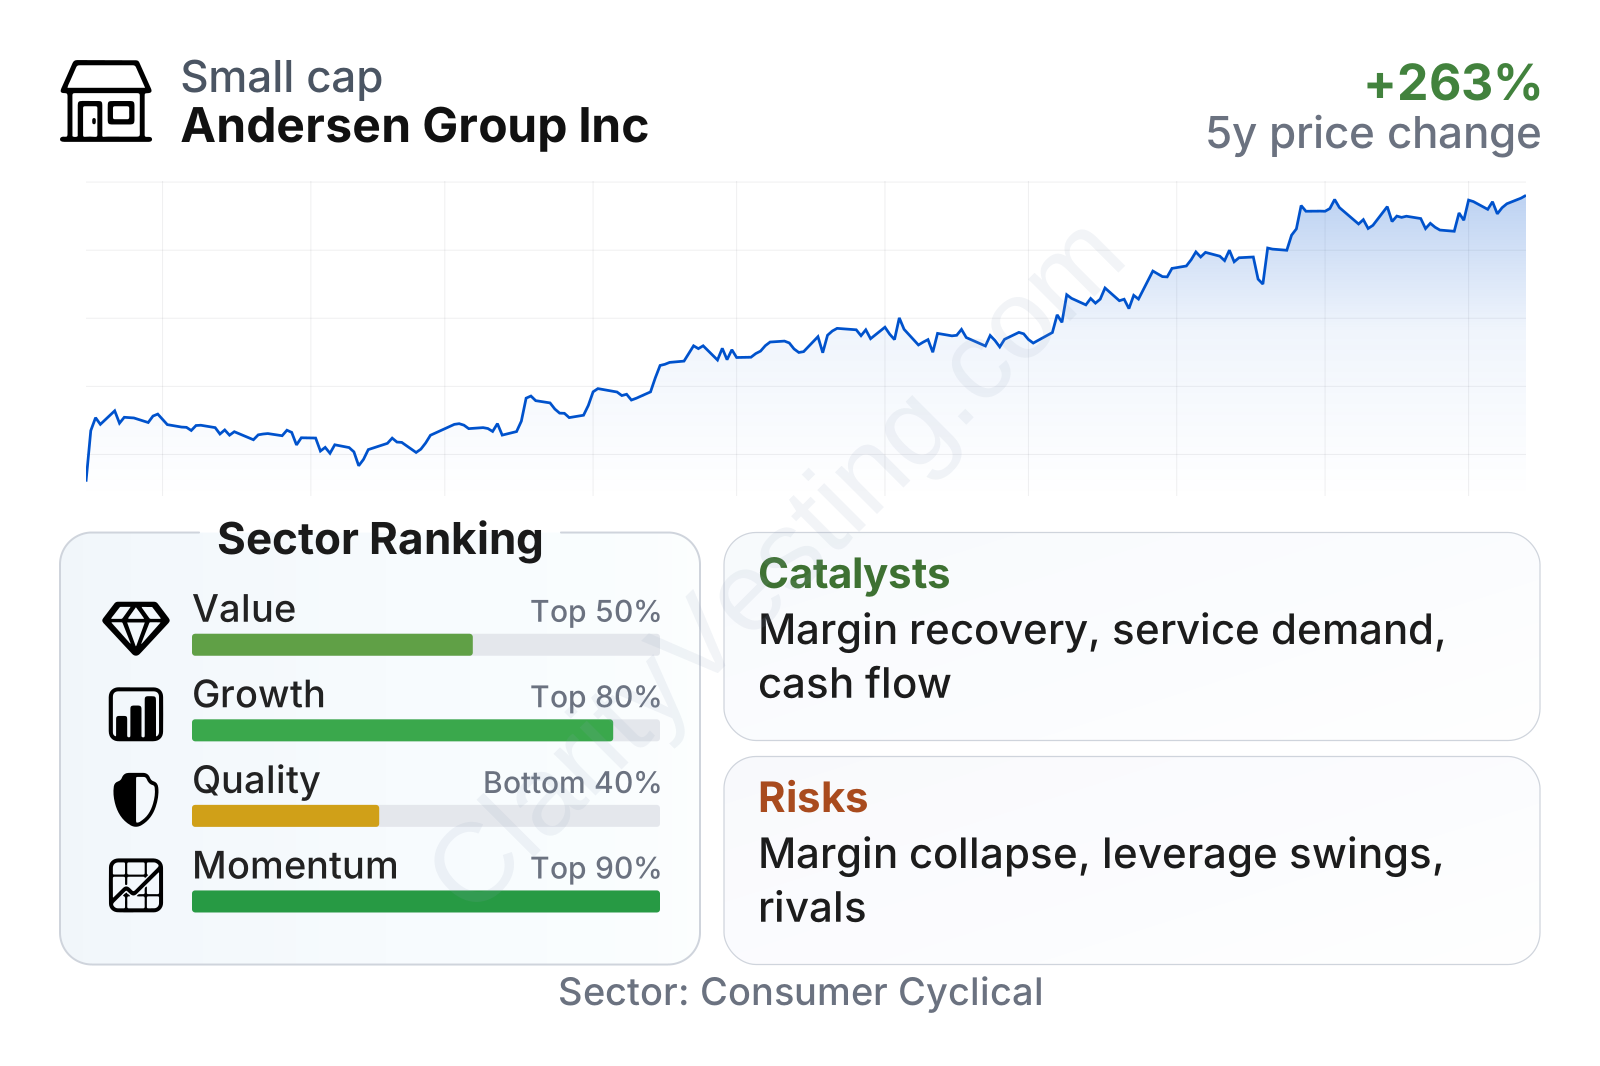
The market currently treats Andersen Group as a smaller public company with unusually strong recent share-price momentum. Growth measures stand out versus the broader consumer cyclical peer group, especially revenue growth and free cash flow expansion over multiple years. Value metrics also look favorable on the surface, with a price-to-earnings ratio below the sector median and a free cash flow yield well above it. However, the quality profile is weaker: recent operating margin turned negative, leverage-related readings are distorted by swings in equity, and profitability is less robust than the stronger growth figures might initially suggest.
Growth
Andersen Group operates in a segment that can benefit from long-term demand for outsourced vehicle services, transportation support, and operational efficiency. Businesses that manage fleets, claims, inspections, and logistics often look for outside partners that can reduce turnaround time and administrative complexity. That gives the company exposure to recurring commercial demand rather than purely discretionary consumer spending.
The company’s recent growth profile has been notably strong. Revenue grew about 24% year over year, compared with a sector median near 6%. Over five years, revenue per share compounded at roughly 15% annually, ahead of the sector median near 9%, while free cash flow compounded at close to 24% a year, far above the sector median near 5%. Those numbers suggest that Andersen Group has been able to scale meaningfully over time.
Another positive sign is the dividend trajectory. Dividend per share growth over five years was exceptionally high, which usually indicates management confidence in cash generation at least over that longer period. At the same time, readers should be careful not to view that as proof that recent operating performance is equally strong, because margin pressure has become a real issue.
A visible catalyst is the market’s reassessment of the company in 2026. The stock price rose sharply over the last several quarters, moving from the mid-teens in late 2025 to above $50 by September 2026. Such a move often reflects a combination of improved expectations, corporate developments, and anticipation that the 2025 earnings disruption may prove temporary rather than structural.
For future growth to remain credible, the key question is whether the company can convert revenue expansion back into steady operating profit. If management restores margins while maintaining the current sales trajectory, the business could look materially stronger than recent headline profitability implies.
Risks
This article is for informational purposes only and does not constitute financial advice. Some content is AI-generated. See Disclaimer


