Stock Analysis · Interface Inc (TILE)
Overview
Interface Inc is a global flooring company best known for modular carpet tile, but it also sells luxury vinyl tile and rubber flooring for workplaces, education, healthcare, hospitality, retail, and other commercial interiors. The company’s pitch is not just flooring as a product: it combines design, installation flexibility, replacement ease, and a strong sustainability identity. That matters in commercial buildings, where customers often want durable materials, easier maintenance, and lower disruption during renovations.
Revenue comes primarily from commercial flooring products sold across the Americas, Europe, and Asia-Pacific. Based on company filings and investor materials, the mix is broadly concentrated in a few categories:
- Carpet tile: approximately 70% to 75% of revenue. This is Interface’s core business and includes modular carpet products used in offices, schools, healthcare facilities, and public spaces.
- Luxury vinyl tile (LVT): approximately 20% to 25% of revenue. This category has been an important growth area because customers increasingly want hard-surface flooring alongside carpet.
- Rubber flooring and other products: approximately 3% to 8% of revenue. This includes nora-branded rubber flooring and smaller adjacent offerings.
Geographically, the business is also diversified, with the Americas representing the largest share, followed by Europe and then Asia-Pacific. That gives Interface exposure to several commercial construction and renovation markets rather than relying on one country alone.
Over the last several years, the business has shown a useful pattern: revenue has grown modestly, while profitability has improved more sharply. Gross profit, operating income, and net income have all expanded faster than sales, while interest expense has moved lower. That suggests recent progress has come not only from selling more products, but also from better pricing, product mix, and cost discipline.
Key Figures
| Metric | Value | Sector ⓘ |
|---|---|---|
| Date | Sep 12, 2026 | |
| Context | ||
| Sector | Consumer Cyclical | |
| Industry | Furnishings, Fixtures & Appliances | |
| Market Cap ⓘ | $1.97B | |
| Beta ⓘ | 1.92 | |
Value (Cheapness) | ||
| P/E Ratio ⓘ | 13.71 | 17.10 |
| FCF Yield ⓘ | 6.29% | 8.53% |
| EBIT / EV ⓘ | 8.87% | 6.46% |
| PEG ⓘ | 0.93 | |
Growth (Business expansion) | ||
| Revenue Growth ⓘ | 5.40% | 5.75% |
| RPS Growth (5Y CAGR) ⓘ | 3.59% | 9.14% |
| EPS Growth (5Y CAGR) ⓘ | 0.91% | -18.21% |
| Margin Growth (5Y Trend) ⓘ | 2.75% | -0.23% |
| FCF Growth (5Y CAGR) ⓘ | 20.04% | 4.91% |
Quality (Business durability) | ||
| ROIC (Latest) ⓘ | 18.39% | 12.61% |
| ROIC (5Y Median) ⓘ | 9.79% | 10.72% |
| Net Debt / EBIT (Latest) ⓘ | 1.03 | 2.10 |
| Net Debt / EBIT (5Y Median) ⓘ | 4.24 | 2.32 |
| Operating Margin (Latest) ⓘ | 13.26% | 9.25% |
| Operating Margin (5Y Median) ⓘ | 8.52% | 9.64% |
| Debt to Equity (Latest) ⓘ | 41.12% | 75.78% |
| Profit Margin (Latest) ⓘ | 10.10% | 5.33% |
| Free Cash Flow (Latest) ⓘ | $124.03M | |
Momentum (Price trend) | ||
| 3Y Return ⓘ | +264.28% | +14.53% |
| 12M Return (excl. last month) ⓘ | +48.34% | +3.08% |
| 6M Return ⓘ | +23.77% | +0.55% |
| Price vs. 200-Day MA ⓘ | +10.66% | -0.54% |
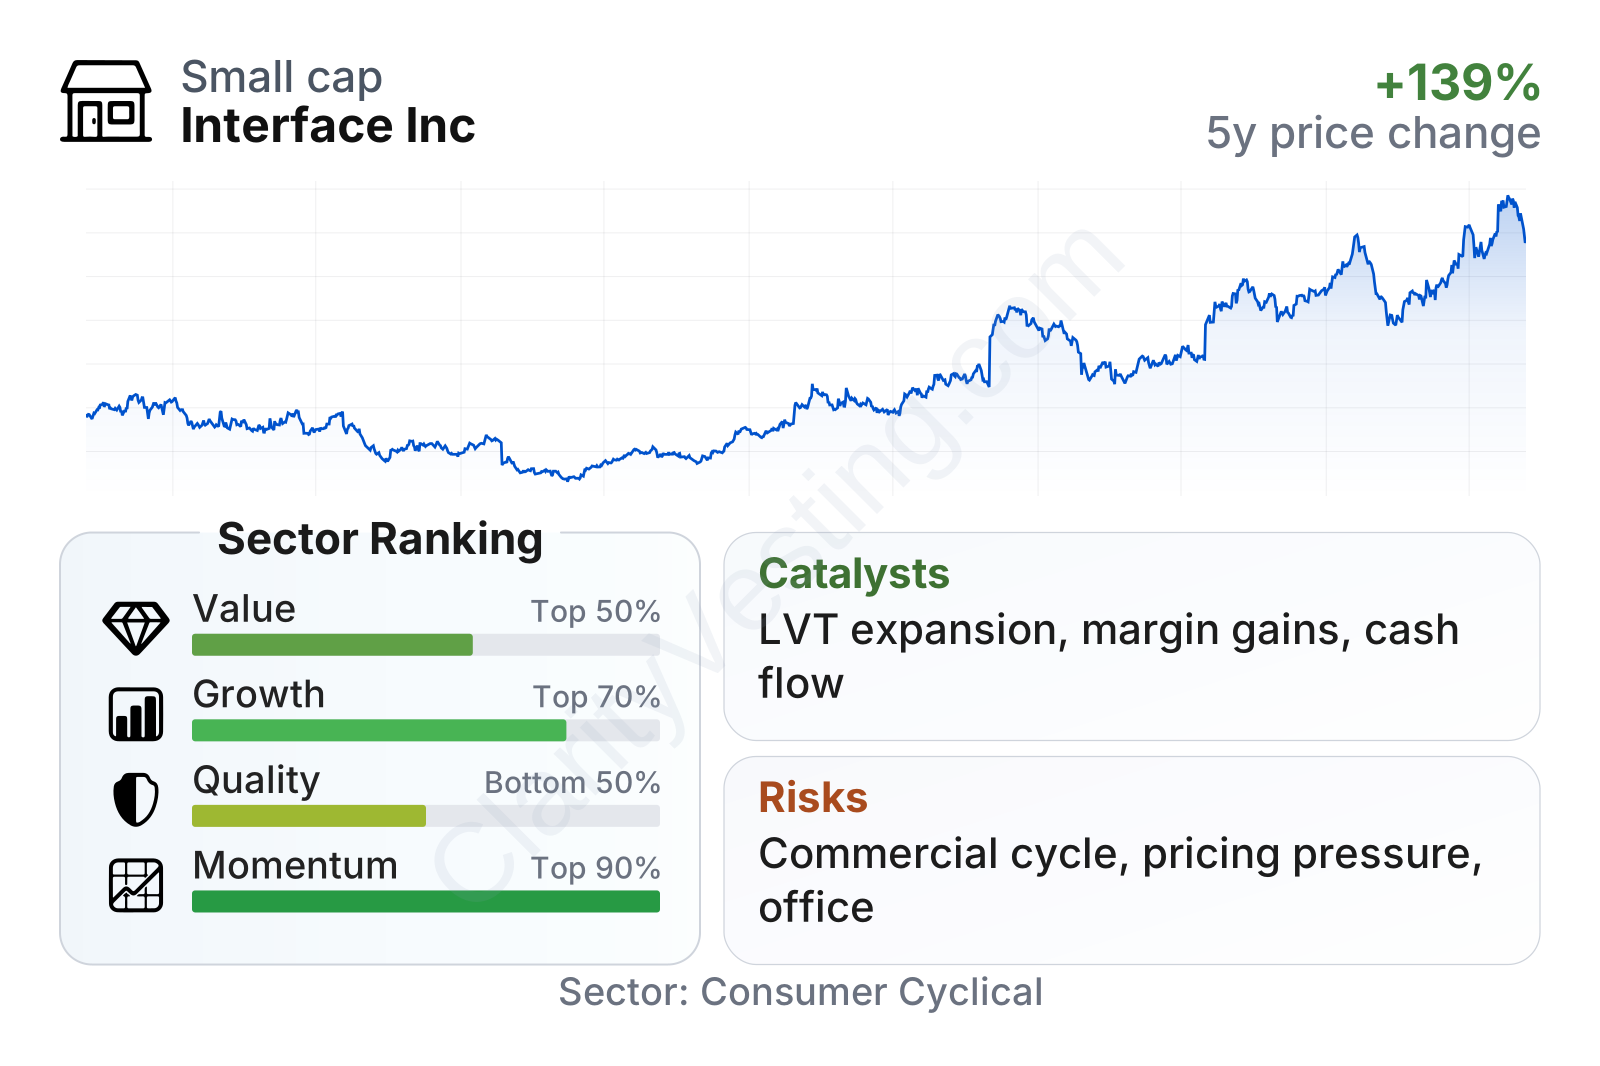
Interface is a mid-sized company with a stock that has been far more volatile than the broader market, reflected in a beta close to 1.9. On valuation, the earnings multiple sits below the sector median, while operating earnings relative to enterprise value looks stronger than average. Growth is more mixed: recent revenue growth is close to the sector median, but the longer five-year sales growth pace has been slower. Profitability and balance sheet metrics are more encouraging, with operating margin, profit margin, and current leverage all standing out positively, even though the broader quality ranking remains only middle-to-lower tier because older leverage levels and uneven historical returns still weigh on the picture.
Growth
Interface operates in a sector tied to commercial interiors, renovation cycles, corporate office decisions, education spending, healthcare construction, and hospitality upgrades. That is not a pure high-growth industry, but it can still produce steady opportunities when a company gains share, expands adjacent categories, and improves mix. In this context, Interface’s strategy makes practical sense: modular carpet remains the base business, while hard-surface flooring and rubber products broaden the addressable market and make the company more relevant in projects where customers want multiple flooring types from one supplier.
A major long-term growth angle is sustainability. Interface has spent years building a brand around lower-carbon materials, recycled content, and environmental product innovation. In commercial specification markets, where architects, designers, and institutional buyers can weigh environmental criteria heavily, this can support differentiation. It is especially relevant in large projects and retrofit work where customers are trying to meet building standards and carbon goals.
Growth has not been perfectly smooth. Revenue moved through a weaker phase in 2023 and part of 2024 before returning to positive year-over-year gains. More recently, the company has been posting mid-single-digit to low-double-digit growth, indicating that demand and execution have improved after that softer period. This recovery matters because it shows the recent earnings improvement is not coming from cost cutting alone.
Cash generation has been one of the clearest positives. Free cash flow has risen strongly over the past several years and is now well above where it stood in 2022. That gives Interface more flexibility for debt reduction, capital spending, and shareholder returns. For a cyclical business, improving cash flow is often one of the best signs that the operating model is becoming more resilient.
Another visible catalyst is the company’s margin expansion. Interface has improved operating margin meaningfully over time, suggesting pricing discipline and mix improvements are working. If commercial flooring demand remains stable and management continues to execute in higher-value categories such as LVT and premium specified interiors, that could support further earnings growth even without dramatic top-line acceleration.
Recent company updates have also highlighted continued progress in sustainability programs, product launches, and commercial market execution. None of these alone changes the company overnight, but together they reinforce the idea that Interface is trying to grow through a mix of innovation, specification-driven selling, and broader product coverage rather than simple volume expansion.
Risks
This article is for informational purposes only and does not constitute financial advice. Some content is AI-generated. See Disclaimer


