Stock Analysis · Best Buy Co. Inc (BBY)
Overview
Best Buy is a large U.S. consumer electronics retailer that sells technology products and related services through stores, websites, and in-home support channels. Its business is built around categories such as computing, mobile phones, televisions, appliances, gaming, audio, smart home devices, and services. The company operates mainly in the United States, with a smaller presence in Canada.
For long-term analysis, Best Buy is easier to understand than many retailers: it mainly earns money by selling physical products, then adds service, support, and membership offerings around those purchases. That makes it a retailer with some recurring and higher-margin activities, but still heavily tied to consumer demand for electronics.
Based on the company’s latest annual disclosures for fiscal 2026, revenue sources can be approximated as follows:
- Appliances, consumer electronics, computing and mobile phone products combined: about 85% to 90% of total revenue. This includes laptops, tablets, smartphones, TVs, headphones, gaming hardware, kitchen appliances, and related accessories.
- Services, memberships, installation, repairs, and warranty-related activities: about 7% to 10% of total revenue. This includes Geek Squad support, delivery and installation, protection plans, and paid membership benefits.
- International operations, mainly Canada: about 5% to 7% of total revenue by geography, with the United States representing about 93% to 95%.
Within the product mix, computing and mobile phones are typically among the largest categories, followed by consumer electronics and appliances, although exact percentages by category can shift from year to year depending on upgrade cycles, product launches, and household spending trends.
Best Buy’s financial structure also shows a retailer with very high merchandise costs and relatively thin profits, which is normal for the sector. Revenue declined meaningfully from the 2022 peak as demand normalized after the pandemic surge, while profits fell more sharply than sales. In fiscal 2026, the business showed signs of stabilization, with revenue roughly flat to slightly improving and earnings recovering from the prior trough, but still below earlier highs.
The broad picture is a business that remains large and cash-generative, yet much more dependent on operational discipline than on wide profit margins. Sales have stopped falling at the same pace seen after the pandemic boom, but the gap between gross profit and final net income remains sensitive to expenses and pricing pressure.
Key Figures
| Metric | Value | Sector ⓘ |
|---|---|---|
| Date | Sep 12, 2026 | |
| Context | ||
| Sector | Consumer Cyclical | |
| Industry | Specialty Retail | |
| Market Cap ⓘ | $19.04B | |
| Beta ⓘ | 1.30 | |
Value (Cheapness) | ||
| P/E Ratio ⓘ | 15.11 | 17.10 |
| FCF Yield ⓘ | 9.28% | 8.53% |
| EBIT / EV ⓘ | 8.76% | 6.46% |
| PEG ⓘ | 1.68 | |
Growth (Business expansion) | ||
| Revenue Growth ⓘ | 3.60% | 5.75% |
| RPS Growth (5Y CAGR) ⓘ | -1.36% | 9.14% |
| EPS Growth (5Y CAGR) ⓘ | -23.76% | -18.21% |
| Margin Growth (5Y Trend) ⓘ | -2.41% | -0.23% |
| FCF Growth (5Y CAGR) ⓘ | -15.90% | 4.91% |
Quality (Business durability) | ||
| ROIC (Latest) ⓘ | 31.46% | 12.61% |
| ROIC (5Y Median) ⓘ | 37.44% | 10.72% |
| Net Debt / EBIT (Latest) ⓘ | 1.05 | 2.10 |
| Net Debt / EBIT (5Y Median) ⓘ | 1.52 | 2.32 |
| Operating Margin (Latest) ⓘ | 4.22% | 9.25% |
| Operating Margin (5Y Median) ⓘ | 3.85% | 9.64% |
| Debt to Equity (Latest) ⓘ | 129.85% | 75.78% |
| Profit Margin (Latest) ⓘ | 3.01% | 5.33% |
| Free Cash Flow (Latest) ⓘ | $1.77B | |
Momentum (Price trend) | ||
| 3Y Return ⓘ | +44.74% | +14.53% |
| 12M Return (excl. last month) ⓘ | +24.76% | +3.08% |
| 6M Return ⓘ | +49.22% | +0.55% |
| Price vs. 200-Day MA ⓘ | +28.51% | -0.54% |
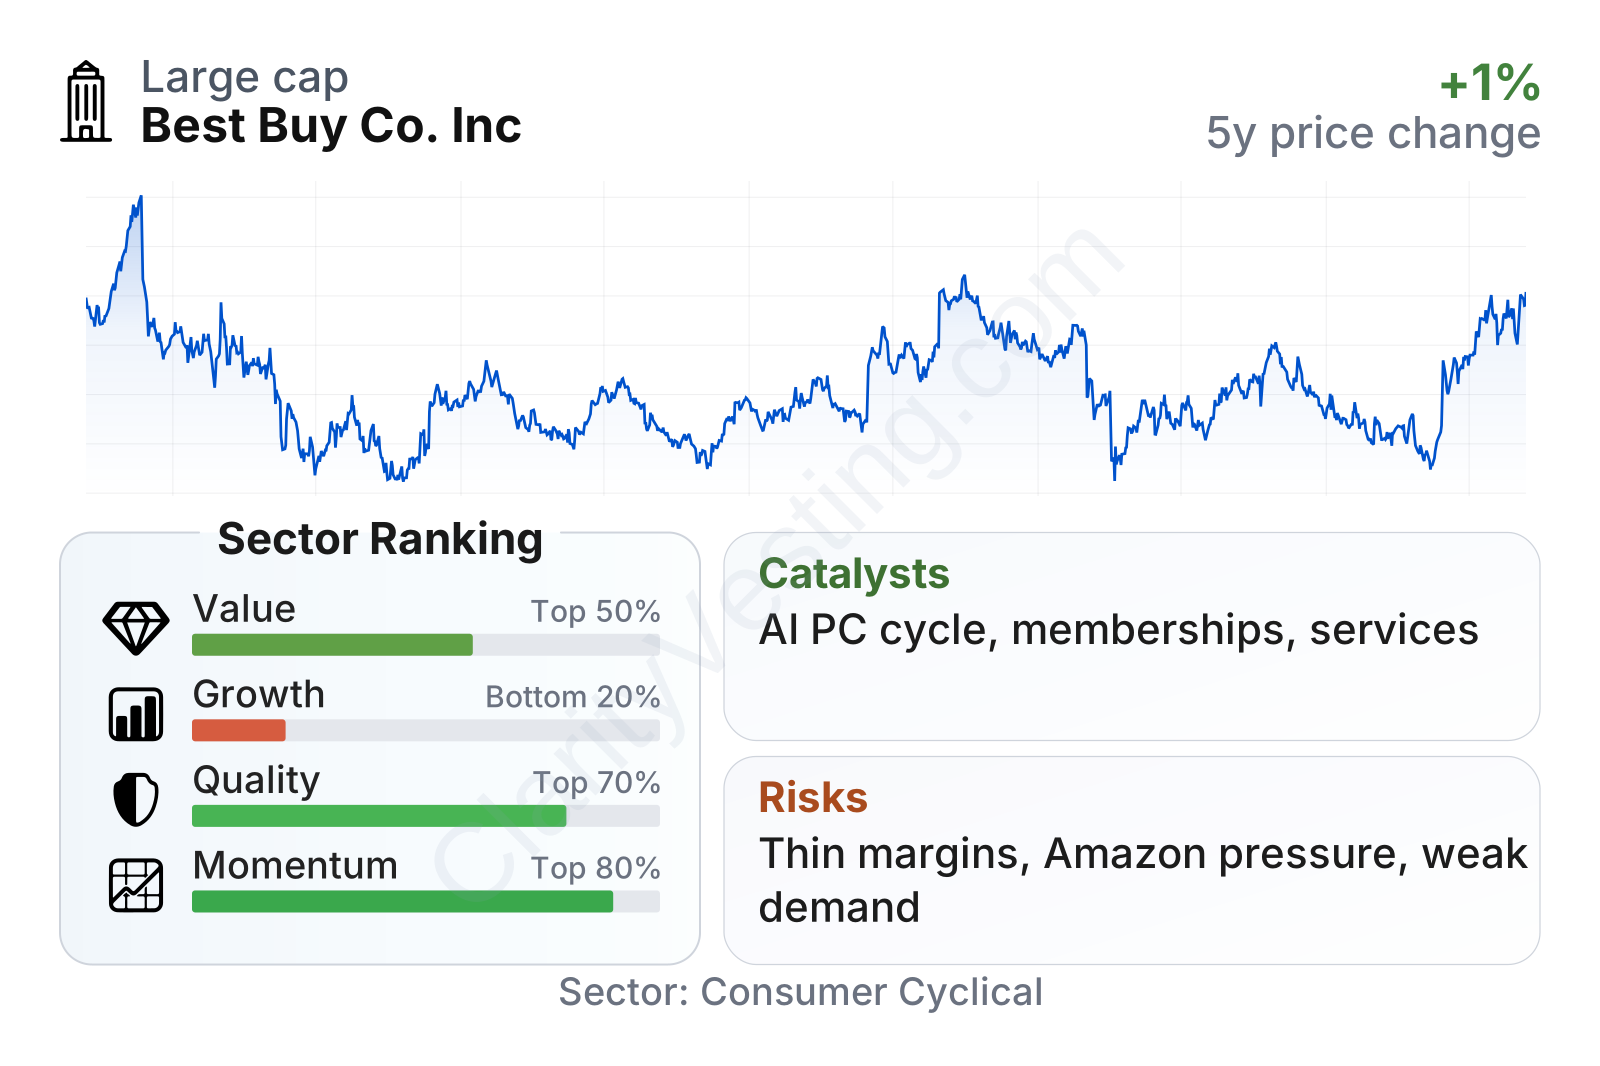
Best Buy stands out more for efficiency and cash generation than for growth. Its valuation metrics sit somewhat below the sector median, while free cash flow yield and operating earnings relative to enterprise value are stronger than many peers. Quality is mixed in an interesting way: returns on invested capital are very strong, net debt relative to earnings is manageable, but operating and profit margins remain below sector norms. Growth is the weakest area, with five-year revenue, earnings, and cash flow trends lagging much of the sector. Share-price momentum, however, has recently been much stronger than average, showing that the market has become more constructive even though the long-term operating trend has been uneven.
In terms of market profile, Best Buy is a mid-to-large retailer rather than a small niche operator. Its beta above 1 also suggests the stock tends to move more than the broader market, which is common for discretionary retail names tied to consumer spending and product cycles.
Growth
Best Buy operates in a sector that has long-term relevance but not constant high growth. Demand for consumer electronics is supported by regular replacement cycles in phones, PCs, TVs, networking gear, and connected-home devices. Over time, new waves such as artificial intelligence-enabled PCs, smart home adoption, health technology, and premium appliances can create pockets of demand. Still, this is not a structurally fast-growing market every year. It tends to move in cycles, with stronger periods around innovation waves and weaker periods when households delay upgrades.
Best Buy’s strategy for future growth is sensible because it does not rely only on opening many new stores. Instead, management has focused on a mix of omnichannel retail, memberships, services, marketplace capabilities, and category expansion in areas such as health and home support. That approach fits the company’s strengths: a national store base, recognized brand, in-home service capabilities, and supplier relationships with major electronics brands.
The most important growth question is whether Best Buy can convert stabilization into sustained expansion. Recent revenue trends have improved after a long contraction.
The pattern suggests the company moved from a difficult post-pandemic reset into modest positive growth by mid-2026. That matters because electronics retail had been pressured for several years by weaker discretionary spending and tough comparisons against unusually strong earlier demand.
Cash generation is another key point because it gives the company flexibility even when sales growth is modest.
Free cash flow dropped sharply from the unusually strong levels seen earlier in the cycle, then recovered to more normal territory. That recovery does not indicate explosive expansion, but it does suggest the business still has meaningful earnings power and working-capital discipline when demand steadies.
A potential catalyst for the next few years is the replacement cycle in computing and mobile devices, especially if AI-capable PCs and other premium electronics encourage upgrades. Best Buy has also highlighted opportunities in paid membership programs, advertising, digital marketplace tools, and services that can deepen customer relationships beyond one-time transactions. If those pieces grow faster than product sales, they could help support margins and reduce some of the volatility tied to hardware demand alone.
Recent company updates in 2026 have broadly pointed to continued efforts around omnichannel execution, cost discipline, and category refreshes rather than any dramatic transformation. That may sound less exciting than a high-growth technology company, but for a mature retailer, steady operational improvement can be the more realistic driver of long-term value creation.
Risks
This article is for informational purposes only and does not constitute financial advice. Some content is AI-generated. See Disclaimer


