Stock Analysis · Constellation Energy Corp (CEG)
Overview
Constellation Energy Corp is one of the largest competitive power producers in the United States. The company sells electricity, natural gas, and energy-related services to homes, businesses, public-sector customers, and wholesale buyers. What makes Constellation stand out is its fleet of nuclear power plants, which gives it a large source of around-the-clock electricity with very low direct carbon emissions. In practical terms, the company sits at the intersection of three themes that matter for long-term analysis: electricity demand, clean energy, and power market pricing.
Its business is not a traditional regulated utility model where profits are mainly set by state regulators. Instead, Constellation earns much of its money in competitive wholesale and retail energy markets. That means results can be stronger when power prices are favorable, but they can also swing more than those of classic regulated utilities.
Based on company reporting, Constellation’s revenue comes primarily from selling power and natural gas, with nuclear generation as the economic backbone of the portfolio. A simple way to think about the revenue mix is:
- Electricity sales to commercial, industrial, public-sector, and residential customers: approximately 70% to 80% of revenue. This includes retail supply contracts and power sold into wholesale markets.
- Natural gas sales: approximately 15% to 25% of revenue. This mainly reflects gas supplied to customers as part of broader energy offerings.
- Other energy-related products and services: approximately 5% to 10% of revenue. This includes sustainability products, risk management, and other customer solutions.
Those percentages are broad approximations because reported revenue can move significantly with commodity prices, hedging activity, and market conditions. More important than the top line alone is the profit structure: over recent years, the company moved from weak profitability to much stronger earnings as power market fundamentals improved and its low-carbon generation fleet became more valuable.
The long-term financial flow shows a sharp improvement from losses in 2021 and 2022 to strong profitability in 2023 and especially 2024. Revenue did not explode higher across the whole period, but margins improved materially, which suggests that pricing, generation economics, and portfolio management mattered more than simple volume growth.
Key Figures
| Metric | Value | Sector ⓘ |
|---|---|---|
| Date | Oct 17, 2026 | |
| Context | ||
| Sector | Utilities | |
| Industry | Utilities - Independent Power Producers | |
| Market Cap ⓘ | $100.34B | |
| Beta ⓘ | 1.13 | |
Value (Cheapness) | ||
| P/E Ratio ⓘ | 27.68 | 17.28 |
| P/B Ratio ⓘ | 3.13 | 1.51 |
| FCF Yield ⓘ | 0.31% | 0.65% |
| Dividend Yield ⓘ | 0.55% | 3.77% |
| EBIT / EV ⓘ | 3.52% | 5.01% |
| PEG ⓘ | 3.74 | |
Growth (Business expansion) | ||
| Revenue Growth ⓘ | 23.00% | 6.10% |
| RPS Growth (5Y CAGR) ⓘ | 9.19% | 3.87% |
| EPS Growth (5Y CAGR) ⓘ | 6.48% | -11.30% |
| BVPS Growth (5Y CAGR) ⓘ | 7.09% | 4.23% |
| Margin Growth (5Y Trend) ⓘ | 8.83% | 3.57% |
| FCF Growth (5Y CAGR) ⓘ | N/A | -8.84% |
| DPS Growth (5Y CAGR) ⓘ | -27.52% | 4.84% |
Quality (Business durability) | ||
| ROIC (Latest) ⓘ | 6.71% | 6.53% |
| ROA (Latest) ⓘ | 4.49% | 3.20% |
| ROIC (5Y Median) ⓘ | 4.03% | 5.95% |
| ROA (5Y Median) ⓘ | 3.32% | 2.75% |
| Net Debt / EBIT (Latest) ⓘ | 5.38 | 7.13 |
| Net Debt / EBIT (5Y Median) ⓘ | 6.30 | 7.23 |
| Net Debt / EBITDA (Latest) ⓘ | 2.99 | 4.31 |
| Net Debt / Assets ⓘ | 24.04% | 38.42% |
| EBITDA / Interest ⓘ | 10.09 | 4.58 |
| Operating Margin (Latest) ⓘ | 14.53% | 20.83% |
| Operating Margin (5Y Median) ⓘ | 6.21% | 20.08% |
| Debt to Equity (Latest) ⓘ | 77.24% | 137.69% |
| Profit Margin (Latest) ⓘ | 11.08% | 11.37% |
| Free Cash Flow (Latest) ⓘ | $309.00M | |
Momentum (Price trend) | ||
| 3Y Return ⓘ | +150.66% | +52.37% |
| 12M Return (excl. last month) ⓘ | -17.75% | +8.84% |
| 6M Return ⓘ | -5.46% | -3.95% |
| Price vs. 200-Day MA ⓘ | -1.70% | -0.79% |
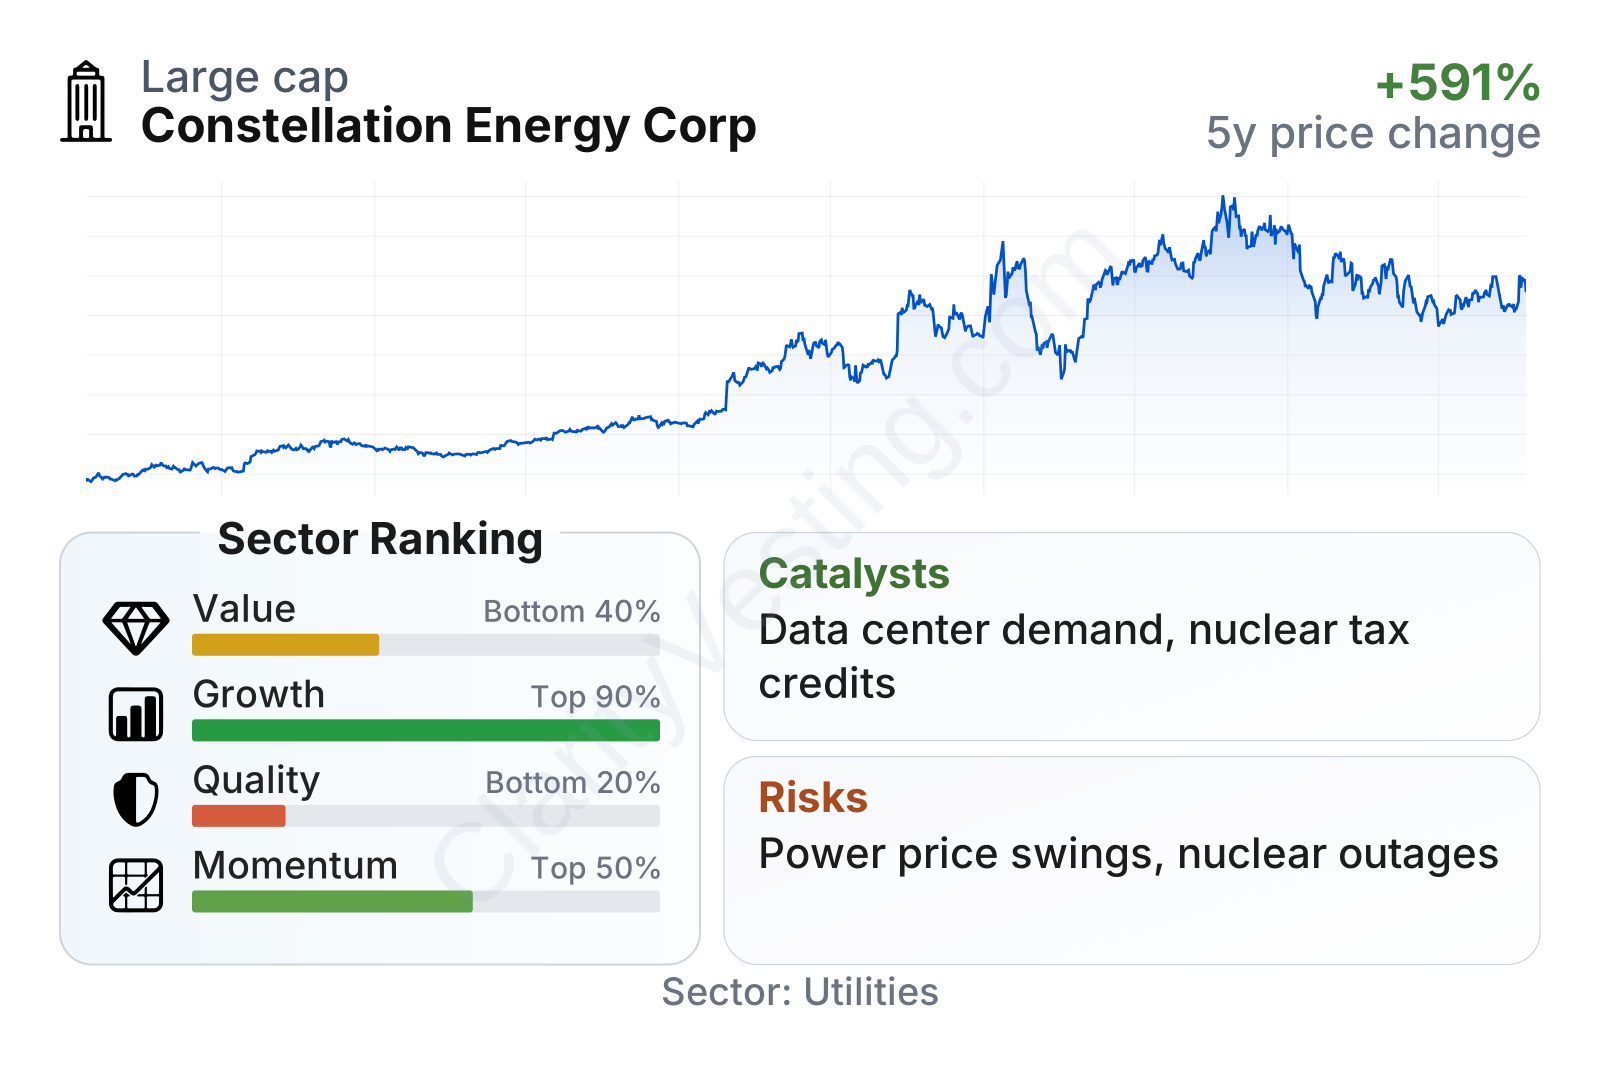
Constellation is a very large company within the U.S. utility and power universe, and its share price has been far more volatile than many utilities. The metrics point to an unusual profile for the sector: strong growth, mixed quality, and a valuation above the sector median. Growth metrics are clearly stronger than many peers, while balance-sheet leverage looks more conservative than the typical utility. On the other hand, income yield is low, free cash flow yield is thin, and recent market momentum has cooled after a very strong multiyear run.
The recent share-price path also shows how differently the market treats Constellation compared with slow-moving utilities. The stock climbed dramatically over the last three years, then pulled back in the more recent period. That pattern usually means the market is reassessing how much future growth and power-price strength should be reflected in the valuation.
Growth
Constellation operates in a sector with credible long-term demand drivers. U.S. electricity consumption is getting support from data centers, electrification, manufacturing reshoring, and the need for reliable low-carbon power. This backdrop is especially relevant for a company with a large nuclear fleet, because nuclear generation can provide stable baseload electricity at scale, something intermittent renewables cannot do on their own.
The company’s strategy makes industrial sense. It already owns hard-to-replicate generation assets, especially nuclear plants, and it pairs that supply with customer-facing retail and clean-energy offerings. This creates a useful combination: generation can benefit from stronger power prices, while customer contracts and energy services deepen commercial relationships. In addition, Constellation has highlighted opportunities tied to 24/7 carbon-free energy needs, an area where nuclear power is increasingly attractive to large electricity users.
Revenue per share has trended upward over the last five years, though not in a perfectly straight line. That matters because it suggests growth has not come only from financial engineering or share-count changes. The pace is better than much of the sector, which supports the view that Constellation is participating in a more favorable part of the power market.
Free cash flow has been a more complicated part of the picture. It was deeply negative for an extended period before turning positive more recently. That kind of swing is important for long-term analysis: it shows the earnings profile can improve faster than cash generation, but it also suggests the business is becoming financially more flexible if the recent positive trend continues.
A major catalyst is the rising value of clean, reliable generation in an economy that needs more electricity. Another support comes from public policy. Federal incentives for nuclear power have improved the economics of existing reactors, helping preserve output from plants that are strategically important to grid reliability and decarbonization. Constellation has also been active in positioning itself around large-load customer demand, including the growing interest from data-center operators and other energy-intensive users seeking dependable carbon-free supply.
Recent company announcements and industry developments have reinforced that backdrop. The broad market focus on AI infrastructure and data-center power demand has increased attention on companies with existing large-scale generation. Constellation is one of the clearer public-market ways to gain exposure to that theme through established nuclear assets rather than early-stage project development.
Risks
This article is for informational purposes only and does not constitute financial advice. Some content is AI-generated. See Disclaimer


