Stock Analysis · Chesapeake Utilities Corporation (CPK)
Overview
Chesapeake Utilities Corporation is a regulated energy delivery company focused mainly on natural gas distribution, transmission, and related infrastructure in the eastern United States. Despite the name, it is not primarily a water utility. Its business mix is centered on moving energy through local distribution networks, interstate and intrastate pipelines, natural gas gathering systems, storage, and selected unregulated energy services. Its service territories include parts of Delaware, Maryland, Virginia, Florida, Ohio, and Pennsylvania, with Florida playing an increasingly important role in expansion projects.
The company’s revenue base is split between regulated utility operations and unregulated energy businesses. Regulated activities are generally the most important for stability because rates and returns are overseen by state commissions or federal regulators, while unregulated operations can add growth but also more volatility. Based on recent annual reporting, the revenue mix is approximately:
- Regulated Energy segment: about 70% to 80% of revenue. This includes natural gas distribution utilities, electric distribution in limited territories, and transmission-related operations. These activities usually provide the most predictable earnings because customer demand is tied to essential energy service and approved rate structures.
- Unregulated Energy segment: about 20% to 30% of revenue. This includes propane distribution, natural gas marketing, virtual pipeline services, compressed natural gas, renewable natural gas initiatives, and other energy-related services. This segment can grow faster, but results can be more sensitive to volumes, commodity conditions, and execution.
Within the broader business, natural gas distribution and transportation infrastructure remain the economic core. That matters for long-term analysis because utility economics are usually driven less by rapid disruption and more by customer growth, capital investment, regulatory recovery, and disciplined financing.
The business has also been expanding through large infrastructure programs. Revenue has moved from roughly $570 million in 2021 to about $930 million in 2025, while operating income and net income also increased over that span. At the same time, interest expense has risen materially, showing that growth has required meaningful capital deployment and financing.
The financial flow over the last several years points to a larger company with improving operating earnings, but also with a noticeably heavier financing burden. In other words, expansion has been productive so far, yet it has not come without cost.
Key Figures
| Metric | Value | Sector ⓘ |
|---|---|---|
| Date | Oct 17, 2026 | |
| Context | ||
| Sector | Utilities | |
| Industry | Utilities - Regulated Gas | |
| Market Cap ⓘ | $3.28B | |
| Beta ⓘ | 0.66 | |
Value (Cheapness) | ||
| P/E Ratio ⓘ | 20.56 | 17.28 |
| P/B Ratio ⓘ | 1.87 | 1.51 |
| FCF Yield ⓘ | -8.57% | 0.65% |
| Dividend Yield ⓘ | 2.16% | 3.77% |
| EBIT / EV ⓘ | 5.81% | 5.01% |
| PEG ⓘ | 2.20 | |
Growth (Business expansion) | ||
| Revenue Growth ⓘ | 4.70% | 6.10% |
| RPS Growth (5Y CAGR) ⓘ | 5.20% | 3.87% |
| EPS Growth (5Y CAGR) ⓘ | -9.18% | -11.30% |
| BVPS Growth (5Y CAGR) ⓘ | 11.58% | 4.23% |
| Margin Growth (5Y Trend) ⓘ | 5.28% | 3.57% |
| FCF Growth (5Y CAGR) ⓘ | N/A | -8.84% |
| DPS Growth (5Y CAGR) ⓘ | 9.64% | 4.84% |
Quality (Business durability) | ||
| ROIC (Latest) ⓘ | 6.28% | 6.53% |
| ROA (Latest) ⓘ | 3.74% | 3.20% |
| ROIC (5Y Median) ⓘ | 6.34% | 5.95% |
| ROA (5Y Median) ⓘ | 3.68% | 2.75% |
| Net Debt / EBIT (Latest) ⓘ | 6.05 | 7.13 |
| Net Debt / EBIT (5Y Median) ⓘ | 6.16 | 7.23 |
| Net Debt / EBITDA (Latest) ⓘ | 4.36 | 4.31 |
| Net Debt / Assets ⓘ | 40.59% | 38.42% |
| EBITDA / Interest ⓘ | 5.27 | 4.58 |
| Operating Margin (Latest) ⓘ | 28.20% | 20.83% |
| Operating Margin (5Y Median) ⓘ | 23.31% | 20.08% |
| Debt to Equity (Latest) ⓘ | 101.27% | 137.69% |
| Profit Margin (Latest) ⓘ | 15.12% | 11.37% |
| Free Cash Flow (Latest) ⓘ | -$281.00M | |
Momentum (Price trend) | ||
| 3Y Return ⓘ | +50.89% | +52.37% |
| 12M Return (excl. last month) ⓘ | +6.19% | +8.84% |
| 6M Return ⓘ | +1.42% | -3.95% |
| Price vs. 200-Day MA ⓘ | +1.77% | -0.79% |
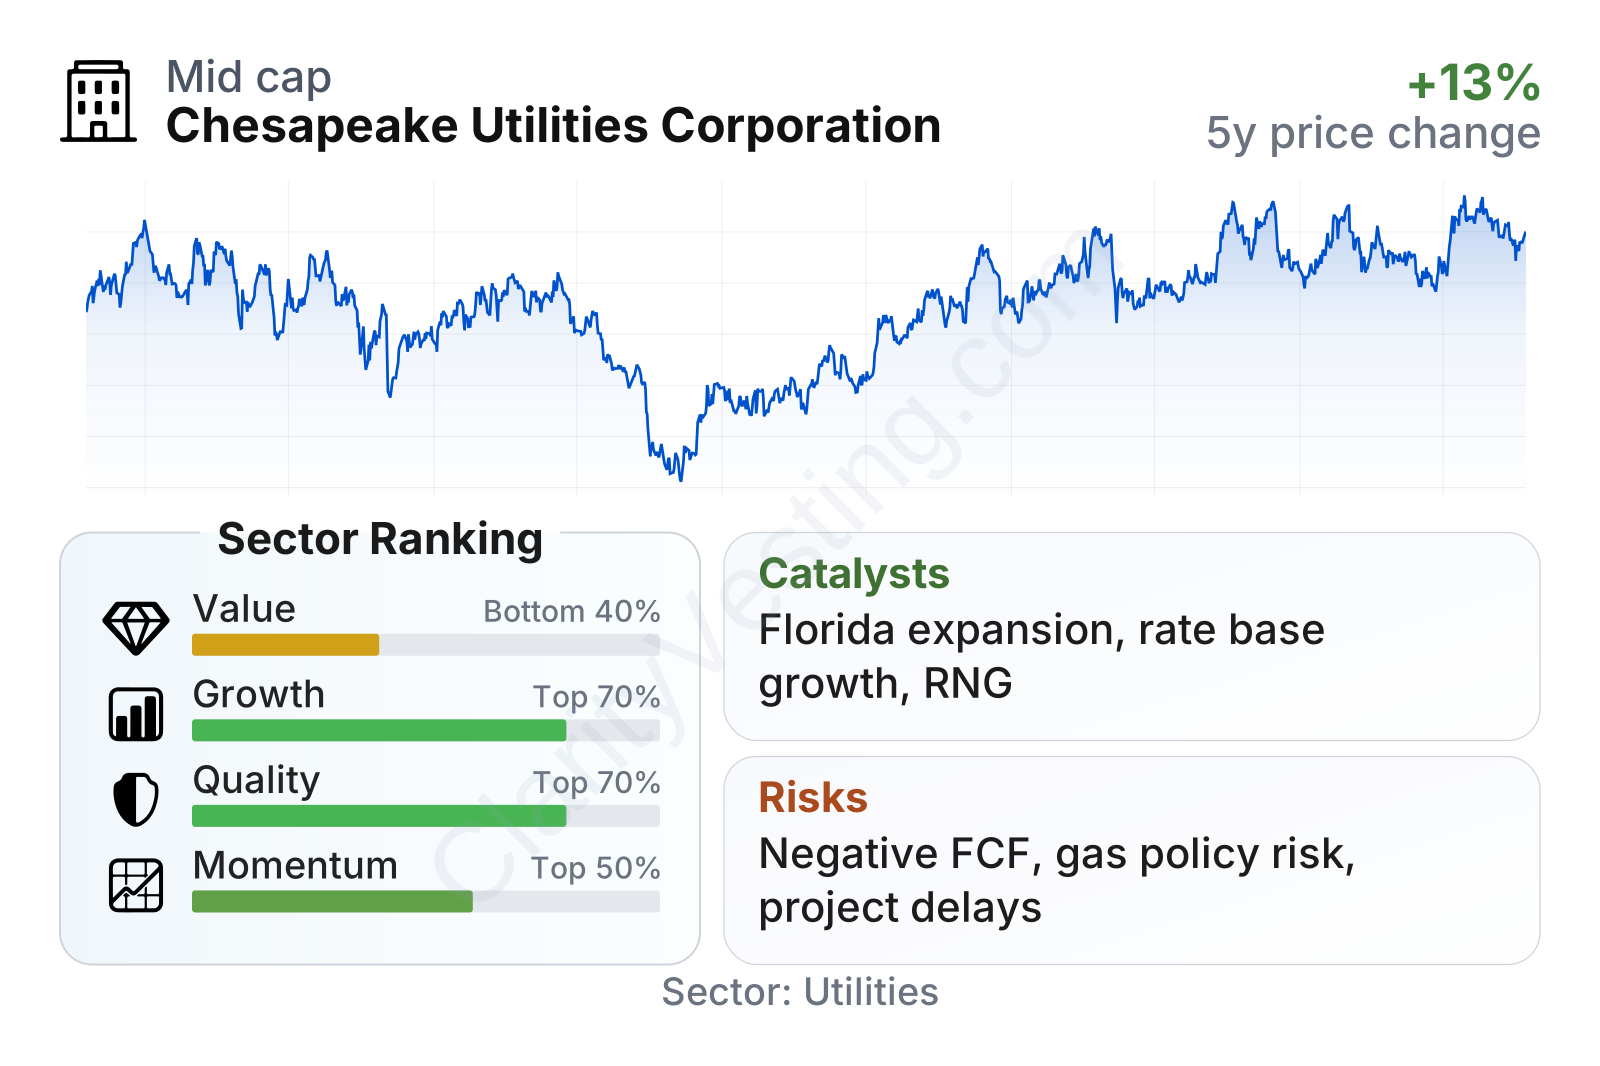
Chesapeake Utilities sits in the mid-cap range and has a relatively low beta of about 0.68, which is typical for a utility with steadier trading behavior than the broader market. On quality and growth measures, it ranks in the upper portion of its sector, supported by operating margins, profitability, book value growth, and dividend growth that compare favorably with many peers. The weaker area is valuation: the shares trade above sector medians on both earnings and book value multiples, while free cash flow remains negative because capital spending is running high.
The trading history also fits that profile. The stock has recovered well from its 2023 weakness and has generally trended upward into 2026, although not in a straight line. That pattern often reflects the market weighing two opposing features at once: dependable regulated utility characteristics on one side, and the pressure from elevated investment spending and financing costs on the other.
Growth
Chesapeake Utilities operates in a sector that is not fast-growing in a technology sense, but it can still compound steadily when population growth, infrastructure replacement, and grid modernization support recurring capital investment. That is especially relevant in regions such as Florida and parts of the Mid-Atlantic, where customer additions and system expansion can continue for years. Utilities often grow by adding customers, extending networks, and earning returns on approved projects rather than by constantly reinventing their business model.
The company’s strategy appears consistent with that model. It has been investing in transmission, distribution, and pipeline-related assets while also building out adjacent platforms such as renewable natural gas and virtual pipeline services. The main attraction of this approach is that it combines the stability of regulated earnings with selected higher-growth opportunities outside the core utility base.
Revenue per share has trended upward over the last five years despite some year-to-year unevenness. The five-year compound growth rate is a little above 5%, which is modest in absolute terms but solid for a regulated gas utility. This suggests that expansion has not relied only on issuing more shares; underlying business growth has also contributed.
Free cash flow is the main tradeoff. It has swung sharply and is currently deeply negative, largely reflecting heavy capital expenditures. For utilities, negative free cash flow is not automatically a warning sign because major infrastructure programs are often financed upfront and recovered over time through rates or contracted cash flows. Still, the ability to convert these projects into future earnings and cash generation is central to the long-term case.
Potential catalysts are fairly clear. New infrastructure entering service, additional customer connections, rate-base growth, and constructive regulatory outcomes can all support earnings expansion. The company has also highlighted projects tied to natural gas transmission, distribution reliability, and renewable gas opportunities, which could widen its addressable market beyond traditional local gas delivery.
Recent corporate updates have broadly pointed to continued project execution and investment across its service footprint rather than any dramatic strategic shift. For a utility, that kind of news flow can be more meaningful than it appears: long-duration, regulated assets often create value gradually through completion milestones, approved rates, and customer growth.
Risks
This article is for informational purposes only and does not constitute financial advice. Some content is AI-generated. See Disclaimer


