Stock Analysis · NiSource Inc (NI)
Overview
NiSource Inc is a regulated utility company focused on delivering natural gas and electricity. Its business is built around essential infrastructure: gas distribution networks, electric distribution systems, and electric generation assets that serve homes, businesses, and industrial customers. The company operates mainly through local utility subsidiaries in several U.S. states, with a particularly strong presence in natural gas distribution. Because most of its operations are regulated, a large share of its earnings depends on rates approved by state regulators rather than on highly cyclical commodity-style pricing.
For long-term analysis, the key point is that NiSource is not a fast-changing technology or consumer brand business. It is an infrastructure-heavy utility whose performance is shaped by customer growth, regulatory approvals, capital investment plans, system modernization, and financing costs. That tends to create steadier demand than many industries, but it also means growth is usually gradual and tied to the company’s ability to earn returns on large spending programs.
Based on the company’s reporting structure, NiSource’s revenue mix is dominated by gas distribution, with electricity as the smaller segment.
- Gas distribution: approximately 75% to 85% of revenue. This includes the delivery of natural gas to residential, commercial, and industrial customers through regulated local utilities.
- Electric operations: approximately 15% to 25% of revenue. This includes electric distribution and generation, primarily through its Indiana utility operations.
Within those categories, customer billing can reflect both the utility service itself and pass-through energy costs, which can make revenue move around even when underlying profitability changes less dramatically. In recent years, NiSource’s total revenue and operating income have both trended upward overall, while interest expense has also climbed, reflecting the cost of carrying and refinancing debt tied to its large capital program.
The business mix shows a utility with improving operating scale and margins over time, but also one that is becoming more interest-sensitive as financing needs rise alongside infrastructure spending.
Key Figures
| Metric | Value | Sector ⓘ |
|---|---|---|
| Date | Oct 17, 2026 | |
| Context | ||
| Sector | Utilities | |
| Industry | Utilities - Regulated Gas | |
| Market Cap ⓘ | $19.90B | |
| Beta ⓘ | 0.55 | |
Value (Cheapness) | ||
| P/E Ratio ⓘ | 22.07 | 17.28 |
| P/B Ratio ⓘ | 2.74 | 1.51 |
| FCF Yield ⓘ | -5.46% | 0.65% |
| Dividend Yield ⓘ | 1.41% | 3.77% |
| EBIT / EV ⓘ | 5.34% | 5.01% |
| PEG ⓘ | 2.02 | |
Growth (Business expansion) | ||
| Revenue Growth ⓘ | 4.60% | 6.10% |
| RPS Growth (5Y CAGR) ⓘ | 4.49% | 3.87% |
| EPS Growth (5Y CAGR) ⓘ | -4.85% | -11.30% |
| BVPS Growth (5Y CAGR) ⓘ | 5.83% | 4.23% |
| Margin Growth (5Y Trend) ⓘ | 6.85% | 3.57% |
| FCF Growth (5Y CAGR) ⓘ | -9.28% | -8.84% |
| DPS Growth (5Y CAGR) ⓘ | 3.90% | 4.84% |
Quality (Business durability) | ||
| ROIC (Latest) ⓘ | 6.26% | 6.53% |
| ROA (Latest) ⓘ | 2.52% | 3.20% |
| ROIC (5Y Median) ⓘ | 5.87% | 5.95% |
| ROA (5Y Median) ⓘ | 2.53% | 2.75% |
| Net Debt / EBIT (Latest) ⓘ | 9.07 | 7.13 |
| Net Debt / EBIT (5Y Median) ⓘ | 9.04 | 7.23 |
| Net Debt / EBITDA (Latest) ⓘ | 5.46 | 4.31 |
| Net Debt / Assets ⓘ | 46.60% | 38.42% |
| EBITDA / Interest ⓘ | 4.10 | 4.58 |
| Operating Margin (Latest) ⓘ | 28.04% | 20.83% |
| Operating Margin (5Y Median) ⓘ | 23.89% | 20.08% |
| Debt to Equity (Latest) ⓘ | 183.46% | 137.69% |
| Profit Margin (Latest) ⓘ | 13.15% | 11.37% |
| Free Cash Flow (Latest) ⓘ | -$1.09B | |
Momentum (Price trend) | ||
| 3Y Return ⓘ | +75.70% | +52.37% |
| 12M Return (excl. last month) ⓘ | +2.83% | +8.84% |
| 6M Return ⓘ | -11.49% | -3.95% |
| Price vs. 200-Day MA ⓘ | -7.15% | -0.79% |
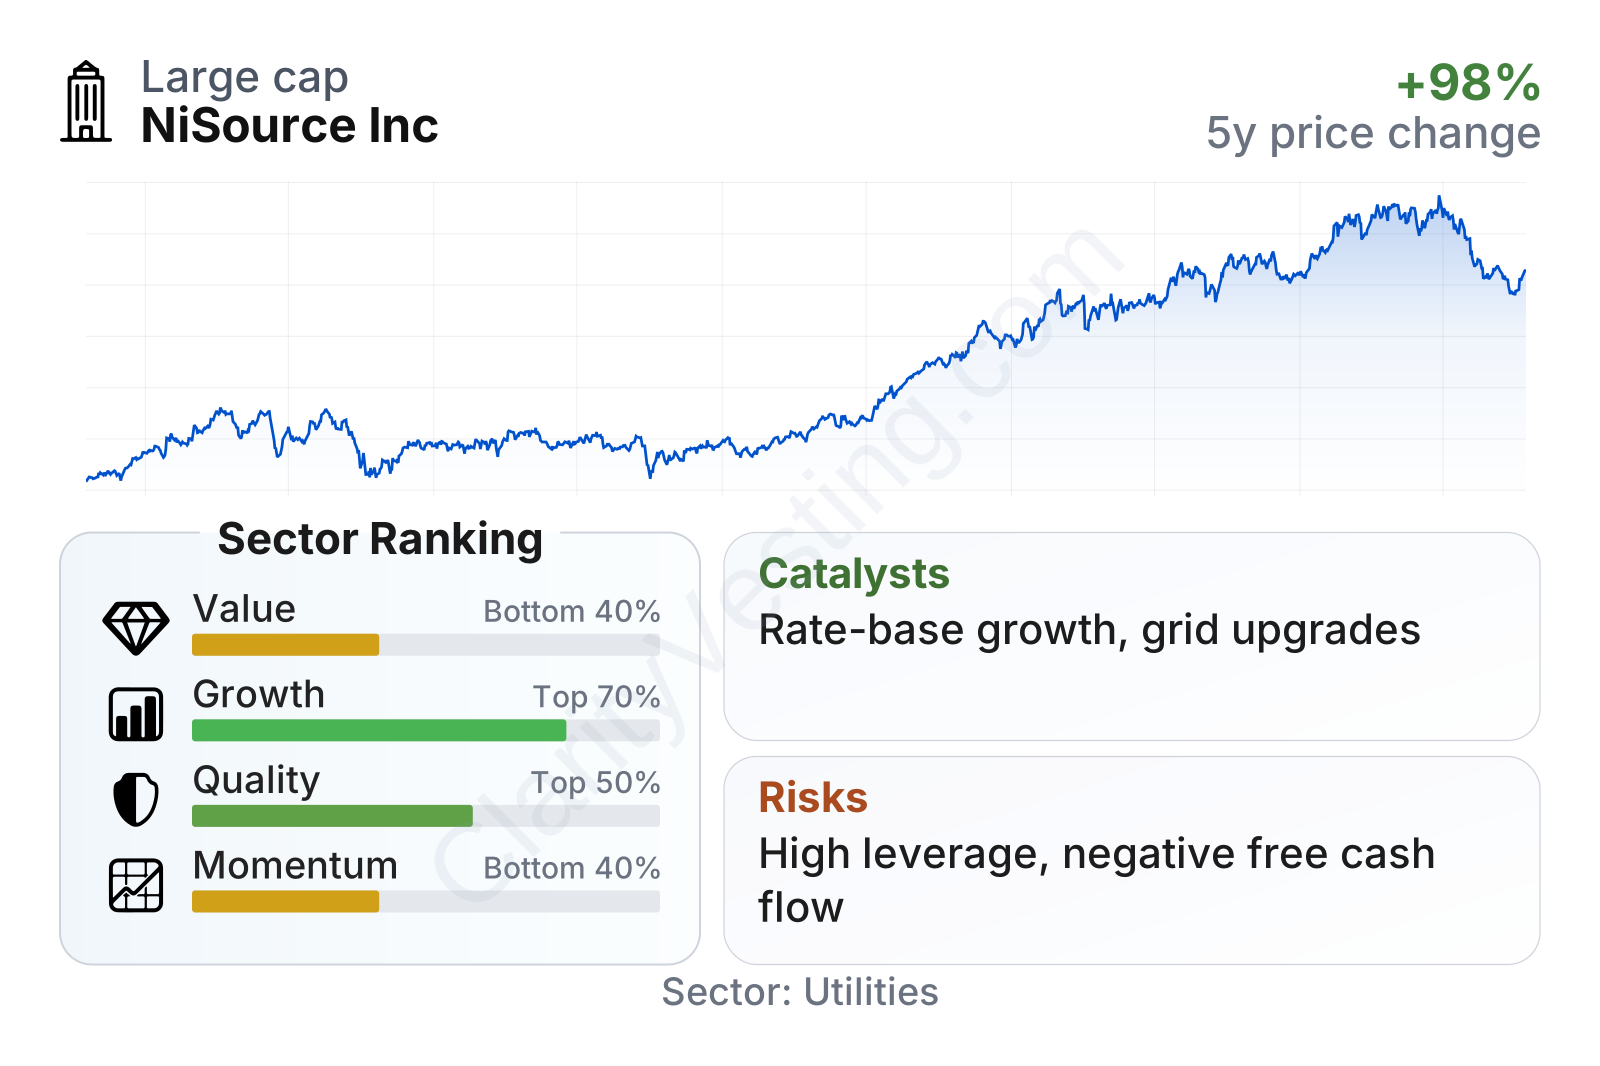
NiSource is a large regulated utility with relatively low share-price volatility, as shown by its beta of about 0.54. In the factor breakdown, growth and operating quality appear better than much of the sector, while value and momentum are weaker. That combination fits a company whose core business is stable and improving operationally, but whose stock already reflects some of that strength and whose recent price trend has cooled.
Profitability is solid for a utility: operating margin is around 28% and profit margin is near 13%, both above sector medians. On the other hand, leverage is elevated, with debt-to-equity around 183% and net debt measures also above typical regulated peers. Free cash flow remains negative, which is common during heavy infrastructure buildouts, but it still matters because it increases reliance on debt and external financing.
Growth
NiSource operates in a sector that is not usually described as high growth, but it can still produce durable expansion through regulated investment. Utilities grow by replacing aging pipes and wires, expanding network capacity, improving reliability, and then earning an allowed return on that capital base. In that context, NiSource is positioned in a part of the market that still has a long runway for modernization, particularly in gas distribution safety programs and electric grid upgrades.
The company’s strategy broadly makes sense for future growth because it is aligned with what regulators generally support: safety, reliability, resilience, and system replacement. This is important. A utility does not need explosive demand growth if it can steadily expand its regulated asset base and translate that into approved earnings growth over time. NiSource has also emphasized long-term infrastructure investment and cleaner electric generation, including the continued evolution of its Indiana electric system.
Revenue per share has moved upward over the past five years, although not in a perfectly straight line. That pattern suggests NiSource is still advancing despite the normal noise created by weather, commodity pass-through effects, and timing differences in regulatory recovery. The company’s five-year revenue-per-share growth is slightly ahead of the sector median, which supports the idea of steady, utility-style expansion rather than stagnation.
One tradeoff is that free cash flow remains negative. For a regulated utility, negative free cash flow is not automatically a warning sign because large capital spending often comes before the earnings benefit is fully reflected in approved rates. Still, persistent cash deficits mean future growth depends not only on project execution but also on continued access to debt and equity markets at workable costs.
A meaningful catalyst is the simple size of NiSource’s investment pipeline. If rate cases, rider mechanisms, and infrastructure replacement programs continue to move forward as planned, the company has a visible path to increasing its rate base and earnings. Another favorable element is that utility demand is tied to essential services, which usually makes revenue more resilient than in cyclical sectors. Recent company communications have also centered on system modernization, reliability work, and long-term capital planning, all of which support the case for continuing regulated growth rather than a one-time rebound.
Risks
This article is for informational purposes only and does not constitute financial advice. Some content is AI-generated. See Disclaimer


