Stock Analysis · NewJersey Resources Corporation (NJR)
Overview
NewJersey Resources Corporation is a regulated energy company centered on natural gas distribution in New Jersey, with additional activities in clean energy investments, energy services, and storage and transportation. Its core business is serving homes and businesses through New Jersey Natural Gas, a regulated utility that earns returns under state-approved frameworks. That regulated base gives the company a more predictable earnings foundation than many non-utility energy businesses.
Based on the company’s recent annual reporting structure, revenue comes from several business lines, although revenue mix and profit mix are not the same because some segments are far more volatile or lower margin than others. Approximate revenue contribution can be summarized as follows:
- New Jersey Natural Gas: about 55% to 65% of revenue in a typical recent year. This is the regulated utility business serving residential, commercial, and industrial customers.
- Energy Services: about 25% to 35% of revenue. This segment includes wholesale natural gas trading, asset management, and optimization activities.
- Storage and Transportation: about 5% to 10% of revenue. This includes natural gas transportation and storage assets.
- Clean Energy Ventures: usually a small single-digit percentage of revenue. This business develops and owns solar and other clean energy investments, where earnings contribution can matter more than top-line size.
The business mix matters because utility revenue is generally steadier, while energy services can move with commodity prices and market conditions. Over the last several years, total revenue has moved around more than profit, reflecting swings in gas prices and trading activity. At the same time, operating income and net income have held up relatively well, which suggests the regulated utility and infrastructure activities remain the economic center of the company.
The overall picture is of a mid-sized utility group whose headline revenue can fluctuate meaningfully, but whose profitability has become more resilient. Recent years show lower revenue than the 2022 peak, yet operating income and net income have improved, pointing to better margins and a more favorable business mix.
Key Figures
| Metric | Value | Sector ⓘ |
|---|---|---|
| Date | Oct 17, 2026 | |
| Context | ||
| Sector | Utilities | |
| Industry | Utilities - Regulated Gas | |
| Market Cap ⓘ | $5.26B | |
| Beta ⓘ | 0.50 | |
Value (Cheapness) | ||
| P/E Ratio ⓘ | 14.36 | 17.28 |
| P/B Ratio ⓘ | 2.00 | 1.51 |
| FCF Yield ⓘ | 1.45% | 0.65% |
| Dividend Yield ⓘ | 3.66% | 3.77% |
| EBIT / EV ⓘ | 6.41% | 5.01% |
| PEG ⓘ | 2.22 | |
Growth (Business expansion) | ||
| Revenue Growth ⓘ | 16.80% | 6.10% |
| RPS Growth (5Y CAGR) ⓘ | -2.17% | 3.87% |
| EPS Growth (5Y CAGR) ⓘ | 8.51% | -11.30% |
| BVPS Growth (5Y CAGR) ⓘ | 8.87% | 4.23% |
| Margin Growth (5Y Trend) ⓘ | 12.59% | 3.57% |
| FCF Growth (5Y CAGR) ⓘ | N/A | -8.84% |
| DPS Growth (5Y CAGR) ⓘ | 10.20% | 4.84% |
Quality (Business durability) | ||
| ROIC (Latest) ⓘ | 7.36% | 6.53% |
| ROA (Latest) ⓘ | 4.69% | 3.20% |
| ROIC (5Y Median) ⓘ | 7.40% | 5.95% |
| ROA (5Y Median) ⓘ | 4.29% | 2.75% |
| Net Debt / EBIT (Latest) ⓘ | 6.52 | 7.13 |
| Net Debt / EBIT (5Y Median) ⓘ | 7.09 | 7.23 |
| Net Debt / EBITDA (Latest) ⓘ | 4.86 | 4.31 |
| Net Debt / Assets ⓘ | 47.93% | 38.42% |
| EBITDA / Interest ⓘ | 5.80 | 4.58 |
| Operating Margin (Latest) ⓘ | 26.37% | 20.83% |
| Operating Margin (5Y Median) ⓘ | 22.75% | 20.08% |
| Debt to Equity (Latest) ⓘ | 146.78% | 137.69% |
| Profit Margin (Latest) ⓘ | 16.42% | 11.37% |
| Free Cash Flow (Latest) ⓘ | $76.09M | |
Momentum (Price trend) | ||
| 3Y Return ⓘ | +38.39% | +52.37% |
| 12M Return (excl. last month) ⓘ | +16.86% | +8.84% |
| 6M Return ⓘ | -5.82% | -3.95% |
| Price vs. 200-Day MA ⓘ | -2.60% | -0.79% |
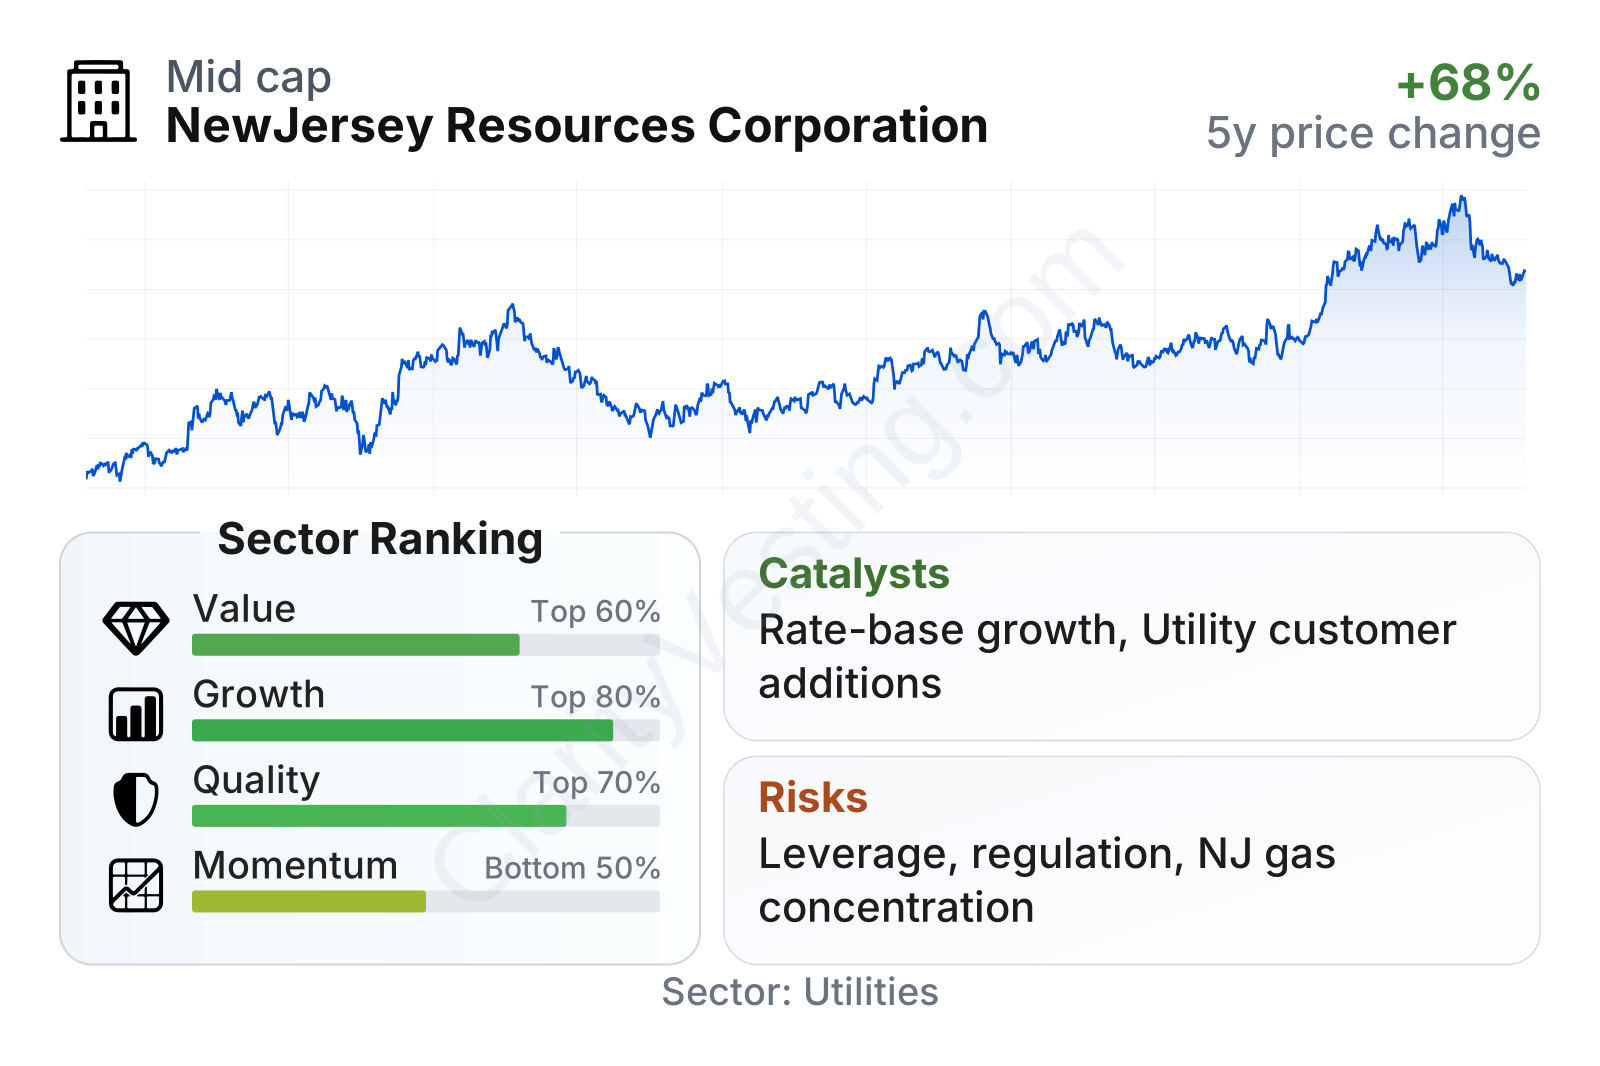
NewJersey Resources sits in the middle of the utility sector by market value and has a relatively low beta, which fits the profile of a defensive stock. The broader factor picture is solid rather than exceptional: value ranks around the better half of the sector, while quality and growth are respectable but not dominant. Profitability measures are notably healthy for a regulated gas utility, with returns on assets and invested capital above sector medians, and margins stronger than many peers. The weaker spot is that long-term revenue per share has been uneven, reminding readers that this is not a straightforward high-growth utility.
Growth
NewJersey Resources operates in a mature sector, not a fast-growing one. Regulated gas distribution is fundamentally a steady-demand business tied to population, infrastructure investment, customer additions, and approved rate recovery rather than explosive market expansion. That said, utilities can still grow at a reasonable pace through capital spending programs, system modernization, and periodic rate cases. In that context, the company’s strategy is sensible: expand and upgrade the regulated network, keep investing in storage and transportation assets, and selectively build clean energy projects that can add another source of returns.
A key point for long-term analysis is that earnings growth appears stronger than revenue growth. Recent metrics show year-over-year revenue growth rebounding, but over a five-year period revenue per share has been uneven and remains below earlier highs because commodity-linked segments can swing sharply.
The revenue-per-share trend shows why headline sales alone can be misleading here. The peak period was driven by a very different commodity environment, while the more recent recovery suggests stabilization rather than a straight-line growth pattern. For a utility like NJR, the more relevant long-term question is whether regulated investments and margin discipline can keep earnings compounding even when revenue is choppy.
That is where the company looks more constructive. Over five years, earnings per share, book value per share, dividend per share, and operating margin trends have all been better than the sector median. This suggests management has been converting capital investment into improved profitability, not just larger scale.
Free cash flow has been volatile and often negative over time, which is common in utilities during periods of heavy capital spending. The latest table shows positive trailing free cash flow, while the longer chart highlights that this is not yet a consistently stable pattern. In practical terms, NJR appears to be in an investment phase where cash generation after capital expenditures can fluctuate, even as accounting earnings remain healthy.
As for catalysts, the most important one is the regulated utility rate base. If NJR continues to add customers, replace aging infrastructure, and secure timely regulatory recovery, that can support steady earnings growth. Another catalyst is clean energy and distributed generation development, which is still small today but can broaden the company’s return profile over time. Recent company updates have also emphasized infrastructure investment and customer growth at New Jersey Natural Gas, which supports the idea that future expansion is likely to come from core utility execution rather than a dramatic shift in the business model.
Risks
This article is for informational purposes only and does not constitute financial advice. Some content is AI-generated. See Disclaimer


