Stock Analysis · Brookfield Infrastructure Partners LP (BIP)
Overview
Brookfield Infrastructure Partners LP is a global owner and operator of essential infrastructure. In simple terms, it buys, improves, and runs assets that economies rely on every day: electricity and gas networks, freight transportation systems, data infrastructure, and regulated utility-like operations. The business is built around long-life assets that are difficult and expensive to replace, which can give revenue a relatively stable base compared with more cyclical industries.
Brookfield Infrastructure operates through four main segments. Based on the company’s recent annual reporting, revenue is spread across a diversified mix rather than relying on a single business line. Approximate segment contribution can shift from year to year because of acquisitions, disposals, and currency movements, but the current structure is broadly as follows:
- Transport: approximately 35% to 40% of revenue. This includes rail networks, toll roads, ports, and midstream-related logistics that move goods, energy, and commodities.
- Utilities: approximately 25% to 30% of revenue. This includes regulated distribution and transmission assets for natural gas, electricity, and similar essential services.
- Midstream: approximately 20% to 25% of revenue. This segment includes natural gas pipelines, storage, and processing infrastructure.
- Data: approximately 10% to 15% of revenue. This includes telecom towers, fiber networks, and data-related infrastructure supporting digital connectivity.
The group’s economic engine is not only accounting revenue. Management focuses heavily on cash generation from operations and on capital recycling: buying assets, improving them, and eventually selling mature businesses to reinvest in areas with better returns. That matters because traditional net income can look weak for infrastructure companies due to high depreciation, financing costs, and asset-heavy accounting.
Over the last several years, total revenue has expanded materially, rising from roughly $11.5 billion in 2021 to about $23.1 billion in 2025. Operating income also improved over that period. The weaker point is that interest expense climbed sharply as the company carried more debt and financing costs moved higher, limiting the growth in net income.
The business mix shows a company that has become much larger, but also one where financing costs have absorbed a growing share of operating gains. That is a key theme for anyone assessing the long-term picture.
Key Figures
| Metric | Value | Sector ⓘ |
|---|---|---|
| Date | Oct 17, 2026 | |
| Context | ||
| Sector | Utilities | |
| Industry | Utilities - Diversified | |
| Market Cap ⓘ | $28.77B | |
| Beta ⓘ | 1.04 | |
Value (Cheapness) | ||
| P/E Ratio ⓘ | 58.60 | 17.28 |
| P/B Ratio ⓘ | 3.09 | 1.51 |
| FCF Yield ⓘ | -2.00% | 0.65% |
| Dividend Yield ⓘ | 5.01% | 3.77% |
| EBIT / EV ⓘ | 9.50% | 5.01% |
| PEG ⓘ | 4.73 | |
Growth (Business expansion) | ||
| Revenue Growth ⓘ | 19.40% | 6.10% |
| RPS Growth (5Y CAGR) ⓘ | 17.97% | 3.87% |
| EPS Growth (5Y CAGR) ⓘ | 26.02% | -11.30% |
| BVPS Growth (5Y CAGR) ⓘ | -32.64% | 4.23% |
| Margin Growth (5Y Trend) ⓘ | -9.36% | 3.57% |
| FCF Growth (5Y CAGR) ⓘ | -23.68% | -8.84% |
| DPS Growth (5Y CAGR) ⓘ | 7.62% | 4.84% |
Quality (Business durability) | ||
| ROIC (Latest) ⓘ | 8.09% | 6.53% |
| ROA (Latest) ⓘ | 0.33% | 3.20% |
| ROIC (5Y Median) ⓘ | 7.89% | 5.95% |
| ROA (5Y Median) ⓘ | 0.42% | 2.75% |
| Net Debt / EBIT (Latest) ⓘ | 8.91 | 7.13 |
| Net Debt / EBIT (5Y Median) ⓘ | 9.59 | 7.23 |
| Net Debt / EBITDA (Latest) ⓘ | 5.57 | 4.31 |
| Net Debt / Assets ⓘ | 52.24% | 38.42% |
| EBITDA / Interest ⓘ | 2.74 | 4.58 |
| Operating Margin (Latest) ⓘ | 28.52% | 20.83% |
| Operating Margin (5Y Median) ⓘ | 24.50% | 20.08% |
| Debt to Equity (Latest) ⓘ | 1298.91% | 137.69% |
| Profit Margin (Latest) ⓘ | 1.27% | 11.37% |
| Free Cash Flow (Latest) ⓘ | -$576.00M | |
Momentum (Price trend) | ||
| 3Y Return ⓘ | +63.27% | +52.37% |
| 12M Return (excl. last month) ⓘ | +21.87% | +8.84% |
| 6M Return ⓘ | -0.03% | -3.95% |
| Price vs. 200-Day MA ⓘ | -0.79% | -0.79% |
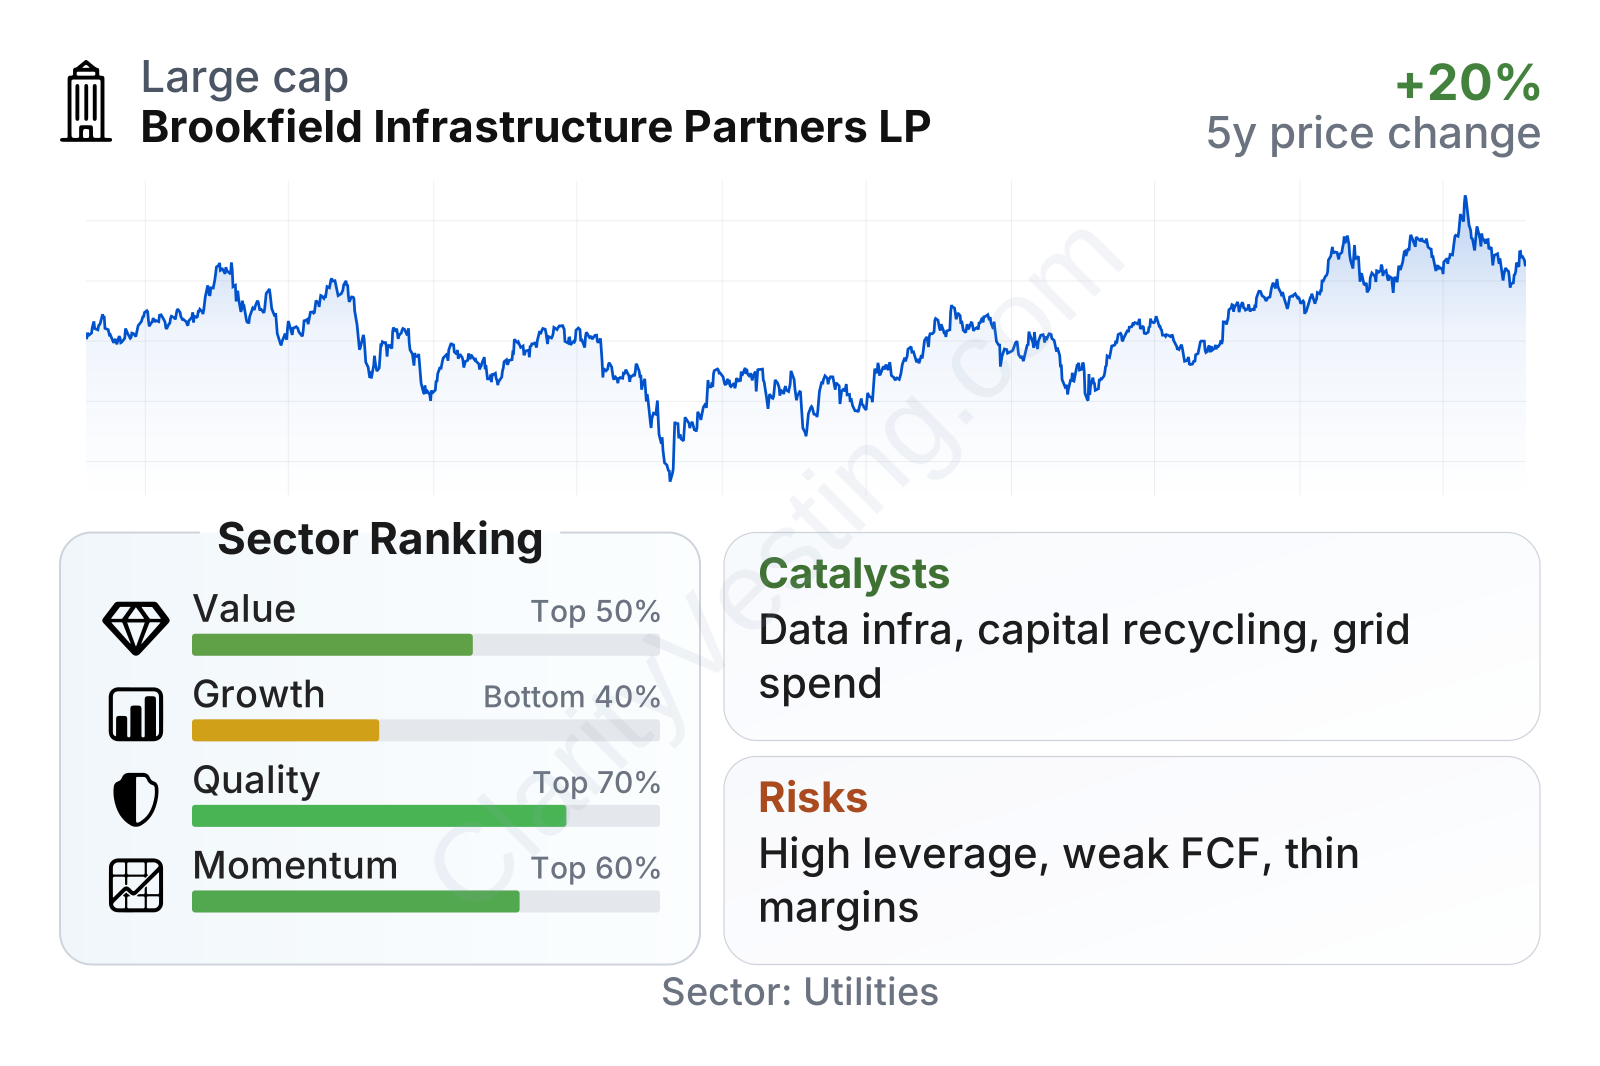
Brookfield Infrastructure is a large listed infrastructure owner with market value in the tens of billions of dollars and share-price volatility close to the broader market. The overall profile is mixed: growth and operating profitability look stronger than many utility peers, while leverage and cash conversion are weaker. The table also shows a business with a relatively high dividend yield, but one trading at much richer earnings and book-value multiples than the sector median. That combination suggests the market is assigning a premium to asset quality, future deal execution, and cash flow durability, even though some headline accounting metrics remain under pressure.
Growth
Brookfield Infrastructure operates in sectors with durable long-term demand. Electricity grids need modernization, natural gas and energy transportation still require reliable networks, freight infrastructure remains essential for trade, and digital connectivity keeps expanding through towers, fiber, and data transport. These are not niche markets. They are core systems that usually benefit from population growth, urbanization, digitalization, and the need to replace aging infrastructure.
The company’s strategy also fits that backdrop well. Brookfield Infrastructure typically targets assets with predictable cash flows, inflation-linked contracts or regulated returns, and room for operational improvements. It then uses its global platform to recycle capital from mature assets into newer opportunities. For a long-term analysis, this is important because future expansion does not depend solely on one product becoming popular. It depends on disciplined capital allocation across multiple essential infrastructure categories.
Revenue per share has climbed strongly over the last five years, with growth far above the utility sector median. That indicates expansion has not only come from issuing more capital or changing asset values; it has also translated into a larger revenue base on a per-share basis. Earnings per share growth over five years has also been strong, although that should be viewed together with the company’s more volatile margins and financing costs.
The weaker part of the growth picture is free cash flow. Recent history shows that cash generation after capital spending has been uneven and has turned negative on a trailing basis. That is not unusual for an infrastructure owner that continues to invest heavily, but it does mean growth is capital-intensive. In other words, Brookfield Infrastructure appears to be growing in attractive sectors, yet that growth requires large amounts of funding and careful balance-sheet management.
A meaningful catalyst is the company’s exposure to data infrastructure and grid-related investment needs. Around the world, power systems need reinforcement, and digital traffic continues to rise. Those trends can create opportunities for fiber, towers, transmission assets, and related utility networks. Brookfield’s global scale and relationship with its broader Brookfield group can help it source transactions that smaller rivals may not access as easily.
Another important catalyst is capital recycling. If the company continues selling mature assets at attractive valuations and reinvesting proceeds into higher-return projects, that can support long-term growth without relying exclusively on external equity issuance. For this business model, execution matters as much as sector growth.
Risks
This article is for informational purposes only and does not constitute financial advice. Some content is AI-generated. See Disclaimer


