Stock Analysis · Southern Company (SO)
Overview
Southern Company is one of the largest regulated utility groups in the United States. Its core business is producing, transmitting, and distributing electricity to customers across the Southeast, mainly through Alabama Power, Georgia Power, Mississippi Power, and Southern Power. It also owns a natural gas business through Southern Company Gas, which distributes gas through local utilities, operates pipeline investments, and serves wholesale customers. In simple terms, Southern Company earns most of its money from essential energy services in territories where demand is relatively stable and rates are largely set through regulation.
The business mix is led by electric operations, with natural gas and other activities making up a smaller share. Based on recent company reporting, the revenue base is approximately organized as follows:
- Electric utilities and related operations: about 70% to 75% — retail electricity sales to residential, commercial, and industrial customers; transmission services; and wholesale electricity activity.
- Natural gas distribution and related businesses: about 20% to 25% — gas utility service, gas marketing, storage, and midstream-related activities.
- Other businesses: about 5% to 10% — competitive generation, energy services, and smaller corporate or intercompany items.
Southern Company’s earnings profile is more important than raw revenue mix because utility revenue can move with fuel costs and regulatory pass-throughs. What matters for long-term analysis is that most profit comes from regulated electric and gas networks, where allowed returns are tied to approved capital investment rather than short-term commodity swings.
Over the last several years, revenue and operating income have generally trended upward, while interest expense has also climbed as the company has funded a very large investment program. Net income has remained resilient, which shows the stability of the regulated model, but the growing financing burden is becoming a more visible part of the picture.
Key Figures
| Metric | Value | Sector ⓘ |
|---|---|---|
| Date | Oct 17, 2026 | |
| Context | ||
| Sector | Utilities | |
| Industry | Utilities - Regulated Electric | |
| Market Cap ⓘ | $101.36B | |
| Beta ⓘ | 0.30 | |
Value (Cheapness) | ||
| P/E Ratio ⓘ | 21.23 | 17.28 |
| P/B Ratio ⓘ | 2.77 | 1.51 |
| FCF Yield ⓘ | 2.54% | 0.65% |
| Dividend Yield ⓘ | 3.42% | 3.77% |
| EBIT / EV ⓘ | 4.79% | 5.01% |
| PEG ⓘ | 1.97 | |
Growth (Business expansion) | ||
| Revenue Growth ⓘ | 0.10% | 6.10% |
| RPS Growth (5Y CAGR) ⓘ | 5.17% | 3.87% |
| EPS Growth (5Y CAGR) ⓘ | -9.82% | -11.30% |
| BVPS Growth (5Y CAGR) ⓘ | 7.50% | 4.23% |
| Margin Growth (5Y Trend) ⓘ | 9.01% | 3.57% |
| FCF Growth (5Y CAGR) ⓘ | N/A | -8.84% |
| DPS Growth (5Y CAGR) ⓘ | 0.95% | 4.84% |
Quality (Business durability) | ||
| ROIC (Latest) ⓘ | 7.10% | 6.53% |
| ROA (Latest) ⓘ | 2.95% | 3.20% |
| ROIC (5Y Median) ⓘ | 6.63% | 5.95% |
| ROA (5Y Median) ⓘ | 2.89% | 2.75% |
| Net Debt / EBIT (Latest) ⓘ | 9.10 | 7.13 |
| Net Debt / EBIT (5Y Median) ⓘ | 9.16 | 7.23 |
| Net Debt / EBITDA (Latest) ⓘ | 5.11 | 4.31 |
| Net Debt / Assets ⓘ | 45.73% | 38.42% |
| EBITDA / Interest ⓘ | 4.40 | 4.58 |
| Operating Margin (Latest) ⓘ | 26.99% | 20.83% |
| Operating Margin (5Y Median) ⓘ | 26.89% | 20.08% |
| Debt to Equity (Latest) ⓘ | 194.81% | 137.69% |
| Profit Margin (Latest) ⓘ | 15.44% | 11.37% |
| Free Cash Flow (Latest) ⓘ | $2.57B | |
Momentum (Price trend) | ||
| 3Y Return ⓘ | +48.93% | +52.37% |
| 12M Return (excl. last month) ⓘ | -2.60% | +8.84% |
| 6M Return ⓘ | -5.31% | -3.95% |
| Price vs. 200-Day MA ⓘ | -1.87% | -0.79% |
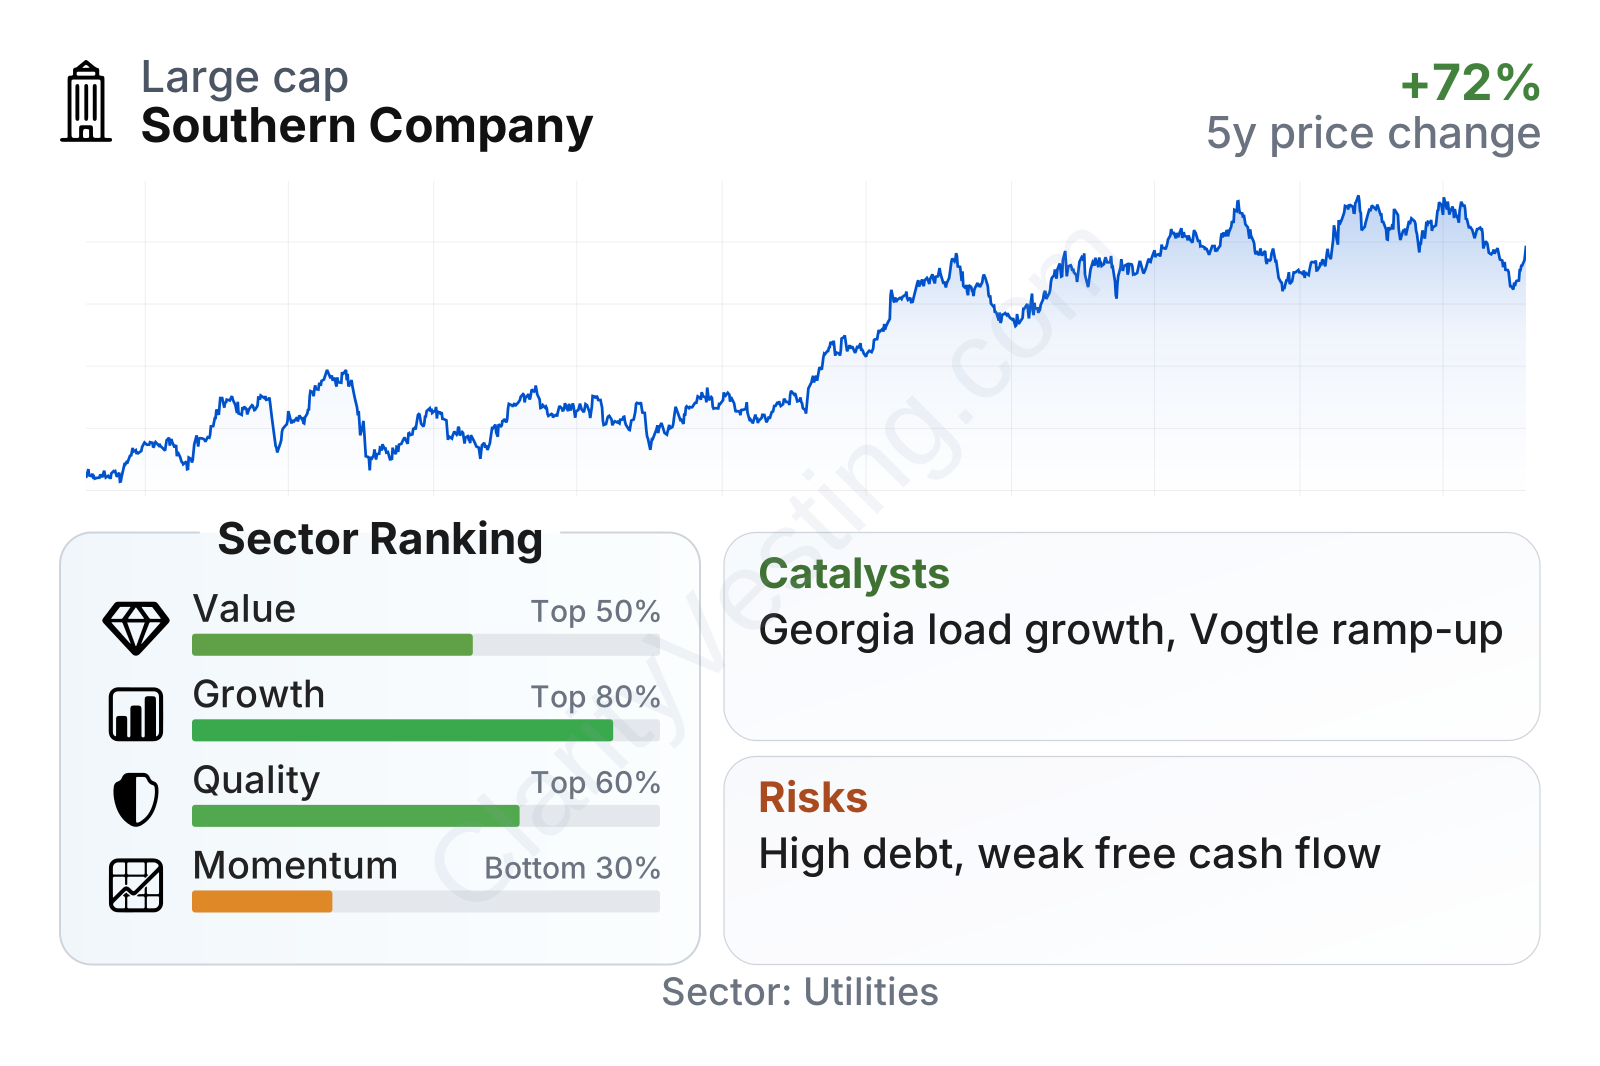
Southern Company is a very large utility with unusually low share-price volatility, reflected in a beta near 0.3. In the factor breakdown, it ranks around the middle of the sector on valuation, somewhat better on quality, and weaker on momentum. That combination fits a mature regulated utility: steady operations, slower expansion, and a market valuation that already recognizes its defensive characteristics.
Profitability metrics remain solid for the industry. Return on invested capital is modest in absolute terms, which is normal for regulated utilities, but it is slightly ahead of the sector median. At the same time, leverage is clearly above typical utility levels, so the balance between stable operations and heavy financing needs is central to understanding the company.
Growth
Southern Company operates in a sector that is growing again after years of being seen mainly as defensive and slow-moving. Electricity demand is being supported by data centers, manufacturing investment, electrification, and grid modernization. In regulated utilities, growth usually comes less from selling dramatically more power and more from expanding the asset base on which regulators allow a return. Southern Company is positioned directly in that model through transmission, generation, and grid investment across fast-growing Sun Belt service areas.
Its strategy broadly makes sense for long-term growth. The company has been investing heavily in generation and infrastructure, especially in Georgia and neighboring markets that continue to attract population and business activity. The completion of Vogtle Units 3 and 4 removed a major construction overhang and added a long-lived nuclear asset that can support carbon-free generation for decades. That matters because utilities with large, already-built low-carbon assets may have an easier time meeting future reliability and emissions goals than peers that still need to build them.
Revenue per share has moved up over the last five years despite some year-to-year swings. That suggests the business has still been expanding on a per-share basis even though headline annual growth has recently been modest. The pace is not rapid, but it is respectable for a regulated electric and gas utility.
A meaningful catalyst is the expected rise in electricity demand from large-load customers, including data centers and industrial facilities, particularly in Georgia. Another support is the continued buildout of transmission and distribution infrastructure, which tends to feed future regulated earnings. Southern Company has also highlighted constructive regulatory frameworks in key states, an important advantage because growth spending only creates value when regulators allow timely recovery.
One caution is cash generation. The company’s trailing free cash flow has been pressured by capital spending, and the recent pattern has been volatile and often negative after investment outlays.
That weak free cash flow is not unusual for a utility in a heavy build cycle, but it does mean growth is being financed largely through debt, equity-linked funding, and regulatory recovery over time rather than through internally generated excess cash today.
Risks
This article is for informational purposes only and does not constitute financial advice. Some content is AI-generated. See Disclaimer


