Stock Analysis · American Electric Power Co Inc (AEP)
Overview
American Electric Power Co Inc is one of the largest regulated electric utilities in the United States. It owns transmission lines, power distribution networks, and power generation assets that deliver electricity to homes, businesses, and industrial customers across multiple states. In simple terms, AEP makes money by building and operating essential power infrastructure and then earning regulated returns that are approved by state utility commissions and, for some transmission assets, by federal regulators.
The business is centered on regulated operations, which usually makes revenue more stable than in many other industries. AEP has also been shifting its portfolio over time toward transmission and distribution, where earnings are generally more predictable and less exposed to power price swings than merchant generation.
Based on the company’s segment reporting in recent annual filings, AEP’s revenue mix is broadly led by its regulated utility operations. Exact percentages can move from year to year, but the structure is approximately as follows:
- Vertically integrated utilities: about 45% to 55% of revenue. These operations generate, transmit, and distribute electricity in regulated service territories.
- Transmission and distribution utilities: about 20% to 30% of revenue. This includes moving electricity over long-distance high-voltage networks and local delivery systems.
- Generation and marketing / other revenue: about 15% to 25% of revenue. This can include wholesale power activity, contracted generation, and other non-core items.
- Corporate and miscellaneous items: typically a small share of reported revenue.
AEP’s revenue is also influenced by fuel and purchased power costs that are often passed through to customers, which means top-line growth does not always translate directly into stronger profitability. What matters more for a utility like AEP is growth in its regulated asset base, allowed returns, customer demand, and cost control.
The long-term pattern has been constructive: revenue has climbed from roughly $16.6 billion in 2021 to nearly $21.8 billion in 2025, while operating income and net income have also moved higher. Profitability improved over that period even as interest expense rose, showing that rate-base growth and operating execution have offset part of the financing pressure.
The business mix has been improving in a favorable direction. Revenue has expanded steadily over the past several years, but the more important signal is that operating income and net income have grown faster than many costs. Interest expense has increased meaningfully, which is normal for a capital-intensive utility, yet the company has still widened profit generation overall.
Key Figures
| Metric | Value | Sector ⓘ |
|---|---|---|
| Date | Oct 17, 2026 | |
| Context | ||
| Sector | Utilities | |
| Industry | Utilities - Regulated Electric | |
| Market Cap ⓘ | $68.40B | |
| Beta ⓘ | 0.47 | |
Value (Cheapness) | ||
| P/E Ratio ⓘ | 21.78 | 17.28 |
| P/B Ratio ⓘ | 2.25 | 1.51 |
| FCF Yield ⓘ | 13.10% | 0.65% |
| Dividend Yield ⓘ | 3.04% | 3.77% |
| EBIT / EV ⓘ | 4.25% | 5.01% |
| PEG ⓘ | 2.00 | |
Growth (Business expansion) | ||
| Revenue Growth ⓘ | 7.00% | 6.10% |
| RPS Growth (5Y CAGR) ⓘ | 6.03% | 3.87% |
| EPS Growth (5Y CAGR) ⓘ | -13.16% | -11.30% |
| BVPS Growth (5Y CAGR) ⓘ | 6.92% | 4.23% |
| Margin Growth (5Y Trend) ⓘ | 4.59% | 3.57% |
| FCF Growth (5Y CAGR) ⓘ | N/A | -8.84% |
| DPS Growth (5Y CAGR) ⓘ | 6.26% | 4.84% |
Quality (Business durability) | ||
| ROIC (Latest) ⓘ | 5.55% | 6.53% |
| ROA (Latest) ⓘ | 2.71% | 3.20% |
| ROIC (5Y Median) ⓘ | 6.29% | 5.95% |
| ROA (5Y Median) ⓘ | 2.95% | 2.75% |
| Net Debt / EBIT (Latest) ⓘ | 10.66 | 7.13 |
| Net Debt / EBIT (5Y Median) ⓘ | 9.79 | 7.23 |
| Net Debt / EBITDA (Latest) ⓘ | 6.18 | 4.31 |
| Net Debt / Assets ⓘ | 43.70% | 38.42% |
| EBITDA / Interest ⓘ | 3.95 | 4.58 |
| Operating Margin (Latest) ⓘ | 22.12% | 20.83% |
| Operating Margin (5Y Median) ⓘ | 22.28% | 20.08% |
| Debt to Equity (Latest) ⓘ | 166.44% | 137.69% |
| Profit Margin (Latest) ⓘ | 13.78% | 11.37% |
| Free Cash Flow (Latest) ⓘ | $8.96B | |
Momentum (Price trend) | ||
| 3Y Return ⓘ | +88.72% | +52.37% |
| 12M Return (excl. last month) ⓘ | +15.13% | +8.84% |
| 6M Return ⓘ | -5.50% | -3.95% |
| Price vs. 200-Day MA ⓘ | +0.04% | -0.79% |
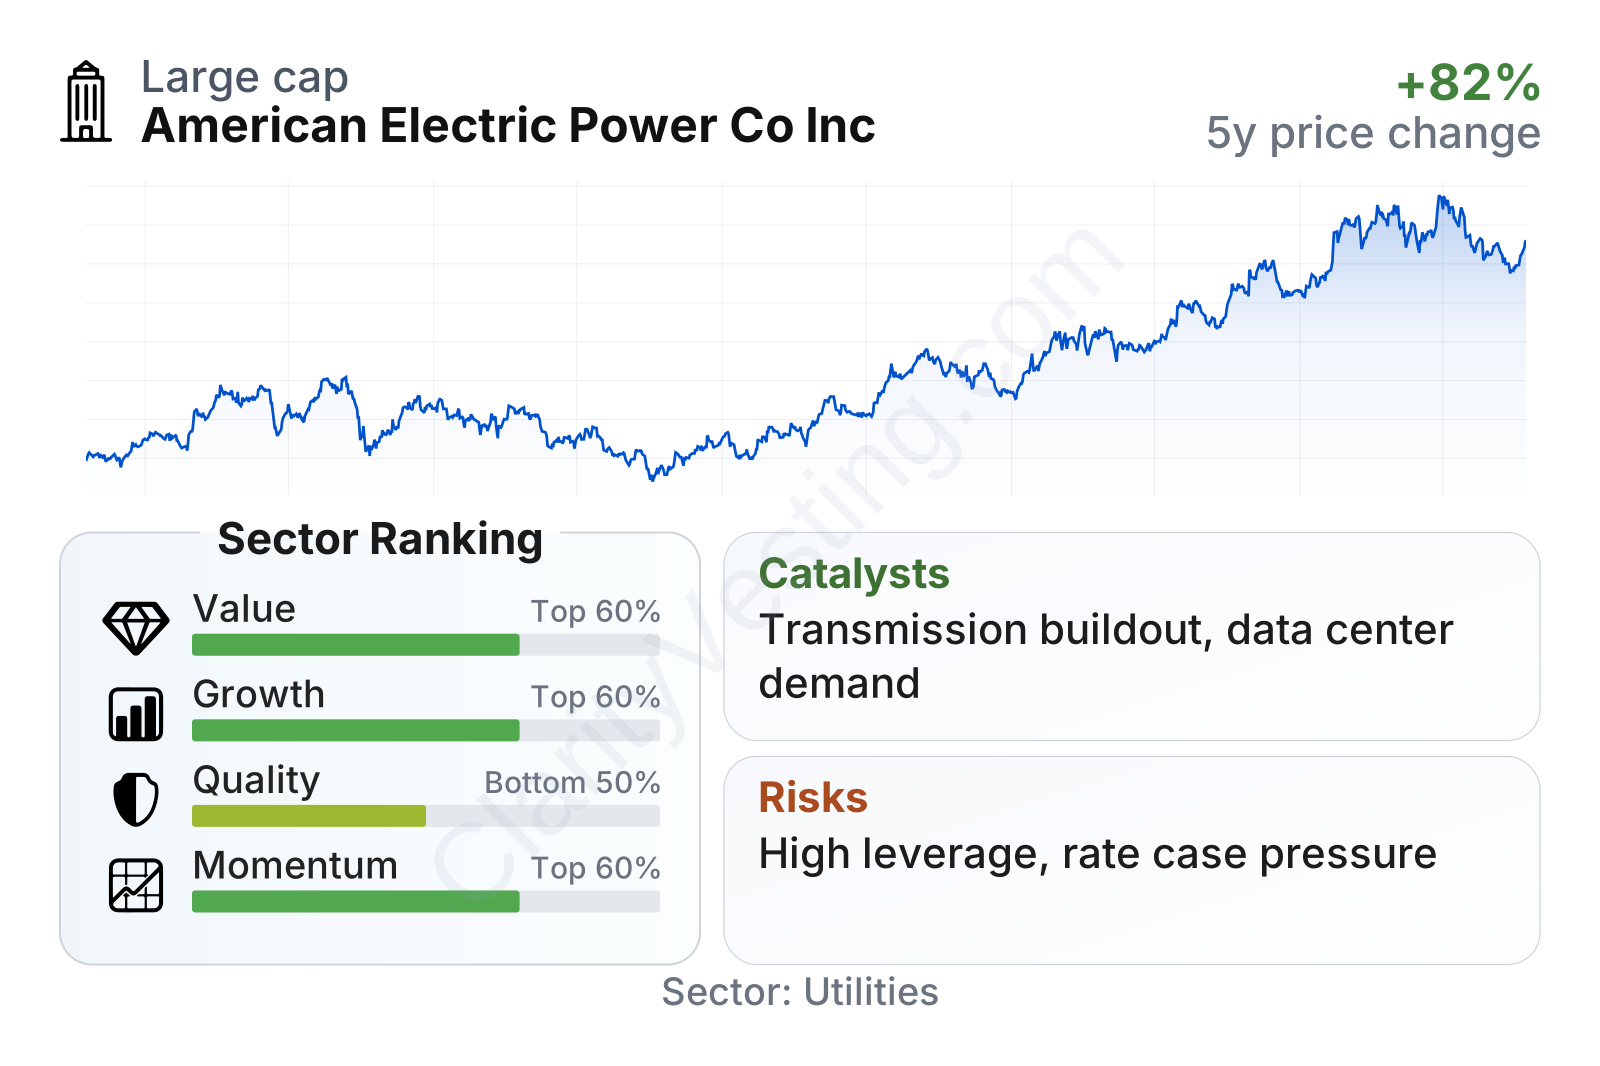
AEP is a very large utility with relatively low share-price volatility, as reflected by a beta of about 0.5. In sector ranking terms, the company looks mixed rather than uniformly strong. Growth and momentum sit around the better half of the utility group, while quality is held back by leverage. Profitability is solid, with operating and net margins above the sector median, but valuation is no longer notably cheap after the stock’s strong multi-year advance.
The stock’s longer-term price trend has been strong. Over the last three years, AEP has outperformed the median utility peer, although the shorter-term picture is softer, with the shares below their 200-day average and weaker over the last six months. That combination often points to a company whose fundamental profile remains steady but whose valuation has become more demanding.
Growth
AEP operates in a sector with durable long-term demand. Electricity use in the United States is being supported by data centers, manufacturing reshoring, grid modernization, electrification, and reliability upgrades. For regulated utilities, growth does not depend only on selling more power. It also comes from investing in networks and equipment that regulators allow the company to earn a return on over time. That framework makes the sector slower-growing than technology, but often more visible and less cyclical.
AEP’s strategy fits that environment. The company has been prioritizing regulated transmission and distribution investment, which is generally the clearest path to steady earnings growth in the utility industry. This matters because transmission has become more valuable as the grid needs reinforcement for rising electricity demand, renewable integration, and resilience spending. AEP already has one of the largest transmission footprints in the country, which gives it a meaningful platform for future capital deployment.
Revenue per share has risen at a healthy pace over the last five years, landing above the sector median growth rate. The path has not been perfectly linear, but the broader trend suggests that AEP has been able to expand its business without relying only on financial engineering. Book value per share and dividends per share have also advanced faster than the typical utility peer, which supports the view that the regulated asset base has been growing.
Free cash flow has been volatile, which is common in utilities because large construction programs can absorb cash for long periods and then swing sharply as timing changes. The recent move from negative territory to strongly positive free cash flow is notable. It does not remove the need for heavy capital spending, but it does indicate improved financial flexibility compared with the pressure seen in prior periods.
Recent company updates have reinforced the same broad opportunity set: grid investment, system reliability work, and expanding infrastructure to serve large-load customers. In practical terms, if electricity demand from industrial projects and data-center development keeps rising in AEP’s territories and nearby transmission corridors, the company has a credible path to keep adding regulated assets that can support future earnings.
Risks
This article is for informational purposes only and does not constitute financial advice. Some content is AI-generated. See Disclaimer


