Stock Ranking
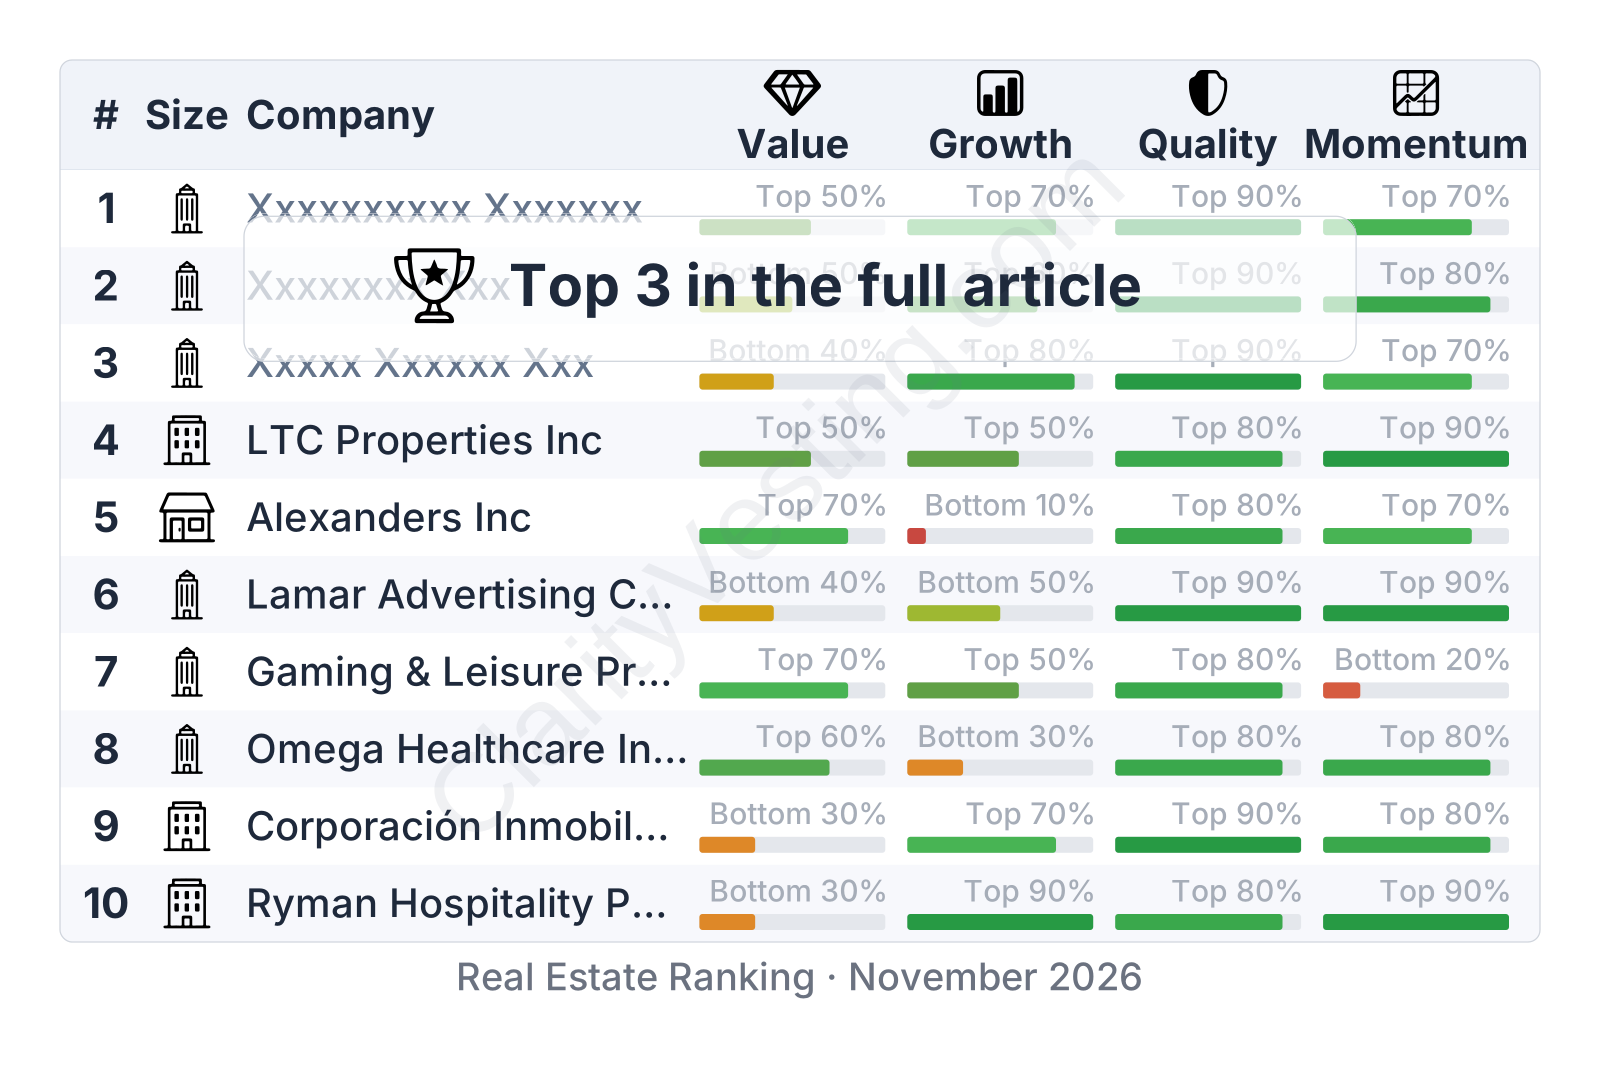
Real Estate Stock Ranking · November 2026
Published 01 Nov 2026
•
Updated 01 Nov 2026
This sector ranking is based on quantitative metrics grouped into four factors:
Value : measures how expensive a stock is relative to the company’s fundamentalsGrowth : measures how quickly the business is expandingQuality : assesses business durability, with a focus on debt levels, margins, and return on invested capitalMomentum : analyzes the current direction and strength of the stock price trendCompanies with strong fundamentals have historically delivered superior long-term performance. However, quantitative metrics alone are not sufficient to evaluate a business. Understanding how a company operates, along with its catalysts and risks, provides a more complete picture.
Quantitative rankings should be used as a starting point for research rather than as standalone investment decisions.
The ranking includes companies across different market capitalizations. Smaller-cap stocks may offer stronger growth opportunities but generally carry higher volatility and business risk.
CopyRight:SVG Design Editor;
configurationStart;Unit=smInches;Dpi=96;Division=4;Grid=True;Zoom=5;CanvasW=122.304;CanvasH=192;configurationEnd;
Large cap
CBRE Group Inc
+26%
5y price change
CopyRight:SVG Design Editor;
configurationStart;Unit=smInches;Dpi=96;Division=4;Grid=True;Zoom=5;CanvasW=240;CanvasH=192;configurationEnd;
Value
Bottom 40%
CopyRight:SVG Design Editor;
configurationStart;Unit=smInches;Dpi=96;Division=4;Grid=True;Zoom=5;CanvasW=193.728;CanvasH=192;configurationEnd;
Growth
Bottom 50%
CopyRight:SVG Design Editor;
configurationStart;Unit=smInches;Dpi=96;Division=4;Grid=True;Zoom=5;CanvasW=160.128;CanvasH=192;configurationEnd;
Quality
Top 90%
CopyRight:SVG Design Editor;
configurationStart;Unit=smInches;Dpi=96;Division=4;Grid=True;Zoom=5;CanvasW=192.672;CanvasH=192;configurationEnd;
Momentum
Bottom 20%
Sector Ranking
Catalysts
Outsourcing growth, deal-market
recovery
Risks
CRE cycle, margin pressure, talent
retention
Sector: Real Estate
ClarityVesting.com
CBRE is a global real estate services leader whose scale now reaches far beyond brokerage into outsourcing, project management, and investment services. That wider model has supported steady revenue expansion and above-sector returns despite a difficult property market.
Stock analysis CBRE Group Inc
CopyRight:SVG Design Editor;
configurationStart;Unit=smInches;Dpi=96;Division=4;Grid=True;Zoom=5;CanvasW=122.304;CanvasH=192;configurationEnd;
Large cap
EastGroup Properties Inc
+16%
5y price change
CopyRight:SVG Design Editor;
configurationStart;Unit=smInches;Dpi=96;Division=4;Grid=True;Zoom=5;CanvasW=240;CanvasH=192;configurationEnd;
Value
Bottom 30%
CopyRight:SVG Design Editor;
configurationStart;Unit=smInches;Dpi=96;Division=4;Grid=True;Zoom=5;CanvasW=193.728;CanvasH=192;configurationEnd;
Growth
Top 80%
CopyRight:SVG Design Editor;
configurationStart;Unit=smInches;Dpi=96;Division=4;Grid=True;Zoom=5;CanvasW=160.128;CanvasH=192;configurationEnd;
Quality
Top 80%
CopyRight:SVG Design Editor;
configurationStart;Unit=smInches;Dpi=96;Division=4;Grid=True;Zoom=5;CanvasW=192.672;CanvasH=192;configurationEnd;
Momentum
Top 70%
Sector Ranking
Catalysts
Sunbelt industrial demand,
development pipeline
Risks
Rich valuation, leasing slowdown,
rate risk
Sector: Real Estate
ClarityVesting.com
EastGroup Properties owns and develops industrial warehouses in fast-growing Sunbelt markets. Rising revenue per share, strong asset returns, and lower leverage help explain why the company commands a premium within real estate and merits a closer look.
Stock analysis EastGroup Properties Inc
CopyRight:SVG Design Editor;
configurationStart;Unit=smInches;Dpi=96;Division=4;Grid=True;Zoom=5;CanvasW=180.864;CanvasH=192;configurationEnd;
Mid cap
First Industrial Realty Trust Inc
+6%
5y price change
CopyRight:SVG Design Editor;
configurationStart;Unit=smInches;Dpi=96;Division=4;Grid=True;Zoom=5;CanvasW=240;CanvasH=192;configurationEnd;
Value
Bottom 40%
CopyRight:SVG Design Editor;
configurationStart;Unit=smInches;Dpi=96;Division=4;Grid=True;Zoom=5;CanvasW=193.728;CanvasH=192;configurationEnd;
Growth
Top 70%
CopyRight:SVG Design Editor;
configurationStart;Unit=smInches;Dpi=96;Division=4;Grid=True;Zoom=5;CanvasW=160.128;CanvasH=192;configurationEnd;
Quality
Top 80%
CopyRight:SVG Design Editor;
configurationStart;Unit=smInches;Dpi=96;Division=4;Grid=True;Zoom=5;CanvasW=192.672;CanvasH=192;configurationEnd;
Momentum
Top 50%
Sector Ranking
Catalysts
Infill logistics demand,
development pipeline
Risks
Rate sensitivity, leasing slowdown,
new supply
Sector: Real Estate
ClarityVesting.com
First Industrial Realty Trust owns and develops U.S. logistics properties in major distribution markets. Strong profitability, improving leverage, and steady per-share growth make it a notable industrial REIT, with valuation now reflecting much of that operating strength.
Stock analysis First Industrial Realty Trust Inc
CopyRight:SVG Design Editor;
configurationStart;Unit=smInches;Dpi=96;Division=4;Grid=True;Zoom=5;CanvasW=180.864;CanvasH=192;configurationEnd;
Mid cap
National Health Investors Inc
+65%
5y price change
CopyRight:SVG Design Editor;
configurationStart;Unit=smInches;Dpi=96;Division=4;Grid=True;Zoom=5;CanvasW=240;CanvasH=192;configurationEnd;
Value
Top 50%
CopyRight:SVG Design Editor;
configurationStart;Unit=smInches;Dpi=96;Division=4;Grid=True;Zoom=5;CanvasW=193.728;CanvasH=192;configurationEnd;
Growth
Bottom 40%
CopyRight:SVG Design Editor;
configurationStart;Unit=smInches;Dpi=96;Division=4;Grid=True;Zoom=5;CanvasW=160.128;CanvasH=192;configurationEnd;
Quality
Top 70%
CopyRight:SVG Design Editor;
configurationStart;Unit=smInches;Dpi=96;Division=4;Grid=True;Zoom=5;CanvasW=192.672;CanvasH=192;configurationEnd;
Momentum
Bottom 20%
Sector Ranking
Catalysts
Aging demographics, senior housing
recovery
Risks
Tenant stress, reimbursement
exposure
Sector: Real Estate
ClarityVesting.com
National Health Investors owns healthcare properties centered on senior housing and skilled nursing. Strong profitability, improving leverage, and demographic tailwinds make it a compelling healthcare REIT to examine, especially as operator conditions continue to normalize.
Stock analysis National Health Investors Inc
CopyRight:SVG Design Editor;
configurationStart;Unit=smInches;Dpi=96;Division=4;Grid=True;Zoom=5;CanvasW=122.304;CanvasH=192;configurationEnd;
Large cap
China Resources Land Ltd
+34%
5y price change
CopyRight:SVG Design Editor;
configurationStart;Unit=smInches;Dpi=96;Division=4;Grid=True;Zoom=5;CanvasW=240;CanvasH=192;configurationEnd;
Value
Top 50%
CopyRight:SVG Design Editor;
configurationStart;Unit=smInches;Dpi=96;Division=4;Grid=True;Zoom=5;CanvasW=193.728;CanvasH=192;configurationEnd;
Growth
Bottom 40%
CopyRight:SVG Design Editor;
configurationStart;Unit=smInches;Dpi=96;Division=4;Grid=True;Zoom=5;CanvasW=160.128;CanvasH=192;configurationEnd;
Quality
Top 80%
CopyRight:SVG Design Editor;
configurationStart;Unit=smInches;Dpi=96;Division=4;Grid=True;Zoom=5;CanvasW=192.672;CanvasH=192;configurationEnd;
Momentum
Top 60%
Sector Ranking
Catalysts
SOE backing, mall income, sector
consolidation
Risks
China home slump, margin pressure,
asset doubts
Sector: Real Estate
ClarityVesting.com
China Resources Land is one of China’s larger state-backed property groups, combining homebuilding with malls and other recurring-income assets. Its balance sheet and cash generation look stronger than many peers, while the stock still reflects deep pessimism around the sector.
Stock analysis China Resources Land Ltd
CopyRight:SVG Design Editor;
configurationStart;Unit=smInches;Dpi=96;Division=4;Grid=True;Zoom=5;CanvasW=180.864;CanvasH=192;configurationEnd;
Mid cap
Apple Hospitality REIT Inc
+57%
5y price change
CopyRight:SVG Design Editor;
configurationStart;Unit=smInches;Dpi=96;Division=4;Grid=True;Zoom=5;CanvasW=240;CanvasH=192;configurationEnd;
Value
Top 50%
CopyRight:SVG Design Editor;
configurationStart;Unit=smInches;Dpi=96;Division=4;Grid=True;Zoom=5;CanvasW=193.728;CanvasH=192;configurationEnd;
Growth
Top 70%
CopyRight:SVG Design Editor;
configurationStart;Unit=smInches;Dpi=96;Division=4;Grid=True;Zoom=5;CanvasW=160.128;CanvasH=192;configurationEnd;
Quality
Top 70%
CopyRight:SVG Design Editor;
configurationStart;Unit=smInches;Dpi=96;Division=4;Grid=True;Zoom=5;CanvasW=192.672;CanvasH=192;configurationEnd;
Momentum
Top 90%
Sector Ranking
Catalysts
Business travel recovery, hotel
renovations
Risks
Travel downturn, brand
concentration
Sector: Real Estate
ClarityVesting.com
Apple Hospitality REIT owns a broad U.S. portfolio of Marriott- and Hilton-branded hotels. Its story centers on a simple lodging model, rebuilt cash flow, a restored dividend, and lower leverage than many peers, making its operating progress worth a closer look.
Stock analysis Apple Hospitality REIT Inc
CopyRight:SVG Design Editor;
configurationStart;Unit=smInches;Dpi=96;Division=4;Grid=True;Zoom=5;CanvasW=216.096;CanvasH=192;configurationEnd;
Small cap
Forestar Group Inc
+19%
5y price change
CopyRight:SVG Design Editor;
configurationStart;Unit=smInches;Dpi=96;Division=4;Grid=True;Zoom=5;CanvasW=240;CanvasH=192;configurationEnd;
Value
Top 80%
CopyRight:SVG Design Editor;
configurationStart;Unit=smInches;Dpi=96;Division=4;Grid=True;Zoom=5;CanvasW=193.728;CanvasH=192;configurationEnd;
Growth
Top 60%
CopyRight:SVG Design Editor;
configurationStart;Unit=smInches;Dpi=96;Division=4;Grid=True;Zoom=5;CanvasW=160.128;CanvasH=192;configurationEnd;
Quality
Top 90%
CopyRight:SVG Design Editor;
configurationStart;Unit=smInches;Dpi=96;Division=4;Grid=True;Zoom=5;CanvasW=192.672;CanvasH=192;configurationEnd;
Momentum
Bottom 20%
Sector Ranking
Catalysts
D.R. Horton demand, lot pipeline
growth
Risks
Housing cycle, customer
concentration
Sector: Real Estate
ClarityVesting.com
Forestar develops finished residential lots for homebuilders, giving it a key role in the U.S. housing chain. Strong returns, moderate leverage, and a deep link to D.R. Horton make the company worth a closer look for readers studying long-term business quality.
Stock analysis Forestar Group Inc
CopyRight:SVG Design Editor;
configurationStart;Unit=smInches;Dpi=96;Division=4;Grid=True;Zoom=5;CanvasW=180.864;CanvasH=192;configurationEnd;
Mid cap
St Joe Company
+60%
5y price change
CopyRight:SVG Design Editor;
configurationStart;Unit=smInches;Dpi=96;Division=4;Grid=True;Zoom=5;CanvasW=240;CanvasH=192;configurationEnd;
Value
Bottom 20%
CopyRight:SVG Design Editor;
configurationStart;Unit=smInches;Dpi=96;Division=4;Grid=True;Zoom=5;CanvasW=193.728;CanvasH=192;configurationEnd;
Growth
Top 80%
CopyRight:SVG Design Editor;
configurationStart;Unit=smInches;Dpi=96;Division=4;Grid=True;Zoom=5;CanvasW=160.128;CanvasH=192;configurationEnd;
Quality
Top 90%
CopyRight:SVG Design Editor;
configurationStart;Unit=smInches;Dpi=96;Division=4;Grid=True;Zoom=5;CanvasW=192.672;CanvasH=192;configurationEnd;
Momentum
Top 80%
Sector Ranking
Catalysts
Florida Panhandle growth, recurring
assets
Risks
Florida concentration, storm and
rate risk
Sector: Real Estate
ClarityVesting.com
St. Joe is a Northwest Florida landowner and developer building a broader platform across housing, hotels, apartments, retail, and marinas. Strong returns, improving scale, and a deep land pipeline make its long-range development path worth a closer look.
Stock analysis St Joe Company
CopyRight:SVG Design Editor;
configurationStart;Unit=smInches;Dpi=96;Division=4;Grid=True;Zoom=5;CanvasW=180.864;CanvasH=192;configurationEnd;
Mid cap
EPR Properties
+2%
5y price change
CopyRight:SVG Design Editor;
configurationStart;Unit=smInches;Dpi=96;Division=4;Grid=True;Zoom=5;CanvasW=240;CanvasH=192;configurationEnd;
Value
Top 90%
CopyRight:SVG Design Editor;
configurationStart;Unit=smInches;Dpi=96;Division=4;Grid=True;Zoom=5;CanvasW=193.728;CanvasH=192;configurationEnd;
Growth
Top 50%
CopyRight:SVG Design Editor;
configurationStart;Unit=smInches;Dpi=96;Division=4;Grid=True;Zoom=5;CanvasW=160.128;CanvasH=192;configurationEnd;
Quality
Top 60%
CopyRight:SVG Design Editor;
configurationStart;Unit=smInches;Dpi=96;Division=4;Grid=True;Zoom=5;CanvasW=192.672;CanvasH=192;configurationEnd;
Momentum
Bottom 30%
Sector Ranking
Catalysts
Experiential acquisitions, lower
rates
Risks
Theater concentration, high
leverage
Sector: Real Estate
ClarityVesting.com
EPR Properties is a specialized REIT centered on experiential real estate, including theaters, attractions, and other leisure venues. Strong margins, recovering revenue, and a standout dividend profile make it an interesting case to examine in long-term real estate analysis.
Stock analysis EPR Properties
CopyRight:SVG Design Editor;
configurationStart;Unit=smInches;Dpi=96;Division=4;Grid=True;Zoom=5;CanvasW=122.304;CanvasH=192;configurationEnd;
Large cap
Host Hotels & Resorts Inc
+87%
5y price change
CopyRight:SVG Design Editor;
configurationStart;Unit=smInches;Dpi=96;Division=4;Grid=True;Zoom=5;CanvasW=240;CanvasH=192;configurationEnd;
Value
Bottom 40%
CopyRight:SVG Design Editor;
configurationStart;Unit=smInches;Dpi=96;Division=4;Grid=True;Zoom=5;CanvasW=193.728;CanvasH=192;configurationEnd;
Growth
Top 80%
CopyRight:SVG Design Editor;
configurationStart;Unit=smInches;Dpi=96;Division=4;Grid=True;Zoom=5;CanvasW=160.128;CanvasH=192;configurationEnd;
Quality
Top 90%
CopyRight:SVG Design Editor;
configurationStart;Unit=smInches;Dpi=96;Division=4;Grid=True;Zoom=5;CanvasW=192.672;CanvasH=192;configurationEnd;
Momentum
Top 90%
Sector Ranking
Catalysts
Luxury travel, redevelopment, low
leverage
Risks
Travel slowdown, group demand, cost
inflation
Sector: Real Estate
ClarityVesting.com
Host Hotels & Resorts owns a large portfolio of upscale and luxury hotels and has emerged from the post-pandemic recovery with stronger cash flow, improving returns, and lower leverage than many peers. The key question now is how much of that quality is already reflected in the valuation.
Stock analysis Host Hotels & Resorts Inc
CopyRight:SVG Design Editor;
configurationStart;Unit=smInches;Dpi=96;Division=4;Grid=True;Zoom=5;CanvasW=180.864;CanvasH=192;configurationEnd;
Mid cap
Ryman Hospitality Properties Inc
+77%
5y price change
CopyRight:SVG Design Editor;
configurationStart;Unit=smInches;Dpi=96;Division=4;Grid=True;Zoom=5;CanvasW=240;CanvasH=192;configurationEnd;
Value
Bottom 30%
CopyRight:SVG Design Editor;
configurationStart;Unit=smInches;Dpi=96;Division=4;Grid=True;Zoom=5;CanvasW=193.728;CanvasH=192;configurationEnd;
Growth
Top 90%
CopyRight:SVG Design Editor;
configurationStart;Unit=smInches;Dpi=96;Division=4;Grid=True;Zoom=5;CanvasW=160.128;CanvasH=192;configurationEnd;
Quality
Top 80%
CopyRight:SVG Design Editor;
configurationStart;Unit=smInches;Dpi=96;Division=4;Grid=True;Zoom=5;CanvasW=192.672;CanvasH=192;configurationEnd;
Momentum
Top 90%
Sector Ranking
Catalysts
Gaylord Rockies expansion, group
bookings
Risks
Convention slowdown, property
concentration
Sector: Real Estate
ClarityVesting.com
Ryman Hospitality Properties owns a rare portfolio of large convention-focused resorts and entertainment assets. Growth has been strong, the dividend has rebounded, and its niche position is hard to replicate, making the operating profile notably different from a typical REIT.
Stock analysis Ryman Hospitality Properties Inc
CopyRight:SVG Design Editor;
configurationStart;Unit=smInches;Dpi=96;Division=4;Grid=True;Zoom=5;CanvasW=180.864;CanvasH=192;configurationEnd;
Mid cap
Corporación Inmobiliaria Vesta S.A.B de C.V
+22%
5y price change
CopyRight:SVG Design Editor;
configurationStart;Unit=smInches;Dpi=96;Division=4;Grid=True;Zoom=5;CanvasW=240;CanvasH=192;configurationEnd;
Value
Bottom 30%
CopyRight:SVG Design Editor;
configurationStart;Unit=smInches;Dpi=96;Division=4;Grid=True;Zoom=5;CanvasW=193.728;CanvasH=192;configurationEnd;
Growth
Top 70%
CopyRight:SVG Design Editor;
configurationStart;Unit=smInches;Dpi=96;Division=4;Grid=True;Zoom=5;CanvasW=160.128;CanvasH=192;configurationEnd;
Quality
Top 90%
CopyRight:SVG Design Editor;
configurationStart;Unit=smInches;Dpi=96;Division=4;Grid=True;Zoom=5;CanvasW=192.672;CanvasH=192;configurationEnd;
Momentum
Top 80%
Sector Ranking
Catalysts
Nearshoring demand, development
pipeline
Risks
U.S. slowdown, development
execution
Sector: Real Estate
ClarityVesting.com
Vesta owns and develops industrial properties in Mexico, with growth tied to logistics and nearshoring demand. Strong profitability, solid balance-sheet discipline, and steady revenue per share make it a notable industrial real estate platform worth deeper examination.
Stock analysis Corporación Inmobiliaria Vesta S.A.B de C.V
CopyRight:SVG Design Editor;
configurationStart;Unit=smInches;Dpi=96;Division=4;Grid=True;Zoom=5;CanvasW=122.304;CanvasH=192;configurationEnd;
Large cap
Omega Healthcare Investors Inc
+133%
5y price change
CopyRight:SVG Design Editor;
configurationStart;Unit=smInches;Dpi=96;Division=4;Grid=True;Zoom=5;CanvasW=240;CanvasH=192;configurationEnd;
Value
Top 60%
CopyRight:SVG Design Editor;
configurationStart;Unit=smInches;Dpi=96;Division=4;Grid=True;Zoom=5;CanvasW=193.728;CanvasH=192;configurationEnd;
Growth
Bottom 30%
CopyRight:SVG Design Editor;
configurationStart;Unit=smInches;Dpi=96;Division=4;Grid=True;Zoom=5;CanvasW=160.128;CanvasH=192;configurationEnd;
Quality
Top 80%
CopyRight:SVG Design Editor;
configurationStart;Unit=smInches;Dpi=96;Division=4;Grid=True;Zoom=5;CanvasW=192.672;CanvasH=192;configurationEnd;
Momentum
Top 80%
Sector Ranking
Catalysts
Aging population, tenant
stabilization
Risks
Tenant stress, Medicaid
reimbursement
Sector: Real Estate
ClarityVesting.com
Omega Healthcare Investors owns skilled nursing and senior care properties, collecting rent and financing income from operators. Recent results show stronger profitability, lower leverage, and a firmer footing in a demographic growth market, making its specialized niche worth a closer look.
Stock analysis Omega Healthcare Investors Inc
CopyRight:SVG Design Editor;
configurationStart;Unit=smInches;Dpi=96;Division=4;Grid=True;Zoom=5;CanvasW=122.304;CanvasH=192;configurationEnd;
Large cap
Gaming & Leisure Properties
+9%
5y price change
CopyRight:SVG Design Editor;
configurationStart;Unit=smInches;Dpi=96;Division=4;Grid=True;Zoom=5;CanvasW=240;CanvasH=192;configurationEnd;
Value
Top 70%
CopyRight:SVG Design Editor;
configurationStart;Unit=smInches;Dpi=96;Division=4;Grid=True;Zoom=5;CanvasW=193.728;CanvasH=192;configurationEnd;
Growth
Top 50%
CopyRight:SVG Design Editor;
configurationStart;Unit=smInches;Dpi=96;Division=4;Grid=True;Zoom=5;CanvasW=160.128;CanvasH=192;configurationEnd;
Quality
Top 90%
CopyRight:SVG Design Editor;
configurationStart;Unit=smInches;Dpi=96;Division=4;Grid=True;Zoom=5;CanvasW=192.672;CanvasH=192;configurationEnd;
Momentum
Bottom 20%
Sector Ranking
Catalysts
Sale-leasebacks, rent escalators,
pipeline
Risks
Tenant concentration, rates, gaming
exposure
Sector: Real Estate
ClarityVesting.com
Gaming & Leisure Properties is a specialized REIT focused on casino real estate, with revenue driven largely by contractual rent. High margins, strong asset returns, and a sizable dividend profile make it a notable name for readers exploring durable, lease-driven real estate businesses.
Stock analysis Gaming & Leisure Properties
CopyRight:SVG Design Editor;
configurationStart;Unit=smInches;Dpi=96;Division=4;Grid=True;Zoom=5;CanvasW=122.304;CanvasH=192;configurationEnd;
Large cap
Lamar Advertising Company
+72%
5y price change
CopyRight:SVG Design Editor;
configurationStart;Unit=smInches;Dpi=96;Division=4;Grid=True;Zoom=5;CanvasW=240;CanvasH=192;configurationEnd;
Value
Bottom 40%
CopyRight:SVG Design Editor;
configurationStart;Unit=smInches;Dpi=96;Division=4;Grid=True;Zoom=5;CanvasW=193.728;CanvasH=192;configurationEnd;
Growth
Bottom 50%
CopyRight:SVG Design Editor;
configurationStart;Unit=smInches;Dpi=96;Division=4;Grid=True;Zoom=5;CanvasW=160.128;CanvasH=192;configurationEnd;
Quality
Top 90%
CopyRight:SVG Design Editor;
configurationStart;Unit=smInches;Dpi=96;Division=4;Grid=True;Zoom=5;CanvasW=192.672;CanvasH=192;configurationEnd;
Momentum
Top 90%
Sector Ranking
Catalysts
Digital billboard conversion,
election ads
Risks
Ad slowdown, rates, regulation,
leverage
Sector: Real Estate
ClarityVesting.com
Lamar Advertising operates one of North America’s largest outdoor ad networks, with billboards accounting for most of its revenue. Hard-to-replicate locations, strong profitability, steady revenue per share growth, and digital conversions that can lift returns from existing assets all shape the story.
Stock analysis Lamar Advertising Company
CopyRight:SVG Design Editor;
configurationStart;Unit=smInches;Dpi=96;Division=4;Grid=True;Zoom=5;CanvasW=216.096;CanvasH=192;configurationEnd;
Small cap
Alexanders Inc
+36%
5y price change
CopyRight:SVG Design Editor;
configurationStart;Unit=smInches;Dpi=96;Division=4;Grid=True;Zoom=5;CanvasW=240;CanvasH=192;configurationEnd;
Value
Top 70%
CopyRight:SVG Design Editor;
configurationStart;Unit=smInches;Dpi=96;Division=4;Grid=True;Zoom=5;CanvasW=193.728;CanvasH=192;configurationEnd;
Growth
Bottom 10%
CopyRight:SVG Design Editor;
configurationStart;Unit=smInches;Dpi=96;Division=4;Grid=True;Zoom=5;CanvasW=160.128;CanvasH=192;configurationEnd;
Quality
Top 80%
CopyRight:SVG Design Editor;
configurationStart;Unit=smInches;Dpi=96;Division=4;Grid=True;Zoom=5;CanvasW=192.672;CanvasH=192;configurationEnd;
Momentum
Top 70%
Sector Ranking
Catalysts
Manhattan asset quality, Stable
dividend
Risks
Property concentration, NYC office
exposure
Sector: Real Estate
ClarityVesting.com
Alexander’s is a concentrated New York REIT built around a handful of high-value properties, led by major Manhattan assets. Strong profitability, a steady dividend, and recent momentum stand out, while the full picture depends on how durable that asset quality proves over time.
Stock analysis Alexanders Inc
CopyRight:SVG Design Editor;
configurationStart;Unit=smInches;Dpi=96;Division=4;Grid=True;Zoom=5;CanvasW=180.864;CanvasH=192;configurationEnd;
Mid cap
LTC Properties Inc
+87%
5y price change
CopyRight:SVG Design Editor;
configurationStart;Unit=smInches;Dpi=96;Division=4;Grid=True;Zoom=5;CanvasW=240;CanvasH=192;configurationEnd;
Value
Top 50%
CopyRight:SVG Design Editor;
configurationStart;Unit=smInches;Dpi=96;Division=4;Grid=True;Zoom=5;CanvasW=193.728;CanvasH=192;configurationEnd;
Growth
Top 50%
CopyRight:SVG Design Editor;
configurationStart;Unit=smInches;Dpi=96;Division=4;Grid=True;Zoom=5;CanvasW=160.128;CanvasH=192;configurationEnd;
Quality
Top 80%
CopyRight:SVG Design Editor;
configurationStart;Unit=smInches;Dpi=96;Division=4;Grid=True;Zoom=5;CanvasW=192.672;CanvasH=192;configurationEnd;
Momentum
Top 90%
Sector Ranking
Catalysts
Aging population, senior housing
recovery
Risks
Tenant stress, reimbursement
pressure
Sector: Real Estate
ClarityVesting.com
LTC Properties owns senior housing and skilled nursing real estate, combining rent income with property-backed financing. Improving profitability, lower leverage, and strong demographic demand make it a healthcare REIT worth a closer look.
Stock analysis LTC Properties Inc
This article is for informational purposes only and does not constitute financial advice. Some content is AI-generated. See Disclaimer