Stock Analysis · St Joe Company (JOE)
Overview
The St. Joe Company is a real estate developer, landowner, and operating business concentrated in Northwest Florida, especially around the Panama City Beach area and the broader Florida Panhandle. Its model is unusual compared with many real estate companies: it owns a very large land base, develops residential and commercial projects on that land, sells homesites and parcels, and also operates recurring-income assets such as apartments, hotels, clubs, retail space, offices, self-storage, and marinas.
That mix matters for long-term analysis. St. Joe is not simply a homebuilder, a REIT, or a hotel owner. It is closer to a land platform that tries to turn a large property position into several cash flow streams over time. The company’s strategy has been to use infrastructure, partnerships, and amenity development to raise the value of its land and attract more residents, tourists, and businesses to its master-planned communities.
Based on recent annual reporting, revenue comes primarily from four broad activities:
- Residential real estate — approximately 40% to 45% of revenue. This includes homesite sales, homes, and other residential land transactions tied to communities under development.
- Hospitality — approximately 20% to 25%. This includes hotels, resorts, golf clubs, food and beverage, and related leisure operations.
- Leasing — approximately 20% to 25%. This includes apartments, commercial leasing, retail, office, industrial, self-storage, and marinas that generate recurring rental income.
- Commercial real estate — approximately 10% to 15%. This includes sales of commercial land and development parcels for retail, mixed-use, and business uses.
The revenue mix can shift from year to year because land sales are lumpy, while leasing and hospitality tend to be steadier. Over the last few years, total revenue has expanded strongly, and operating income has also moved higher, showing that the company has not relied only on rising land values but has also built a larger base of operating assets.
The business has grown from a much smaller revenue base earlier in the decade to a meaningfully larger one, with operating profit rising as more properties came online. One point to watch is that interest expense has also increased, which reflects the cost of building out a larger platform, although profitability has remained solid.
Key Figures
| Metric | Value | Sector ⓘ |
|---|---|---|
| Date | Oct 17, 2026 | |
| Context | ||
| Sector | Real Estate | |
| Industry | Real Estate - Diversified | |
| Market Cap ⓘ | $3.75B | |
| Beta ⓘ | 1.28 | |
Value (Cheapness) | ||
| P/E Ratio ⓘ | 31.09 | 17.38 |
| P/B Ratio ⓘ | 5.12 | 0.85 |
| FCF Yield ⓘ | 5.74% | 7.38% |
| Dividend Yield ⓘ | 0.93% | 4.85% |
| EBIT / EV ⓘ | 5.82% | 3.78% |
| PEG ⓘ | -2.72 | |
Growth (Business expansion) | ||
| Revenue Growth ⓘ | 23.00% | 5.30% |
| RPS Growth (5Y CAGR) ⓘ | 18.38% | 6.02% |
| EPS Growth (5Y CAGR) ⓘ | -6.19% | -11.37% |
| BVPS Growth (5Y CAGR) ⓘ | 7.05% | 0.45% |
| Margin Growth (5Y Trend) ⓘ | 2.31% | -0.22% |
| FCF Growth (5Y CAGR) ⓘ | N/A | 5.40% |
| DPS Growth (5Y CAGR) ⓘ | 16.19% | 5.02% |
Quality (Business durability) | ||
| ROIC (Latest) ⓘ | 13.35% | 5.69% |
| ROE (Latest) ⓘ | 16.34% | 7.56% |
| ROA (Latest) ⓘ | 8.09% | 2.85% |
| ROIC (5Y Median) ⓘ | 10.51% | 4.22% |
| ROE (5Y Median) ⓘ | 12.16% | 6.03% |
| ROA (5Y Median) ⓘ | 5.38% | 2.44% |
| Net Debt / EBIT (Latest) ⓘ | 2.23 | 7.59 |
| Net Debt / EBIT (5Y Median) ⓘ | 4.18 | 8.40 |
| Net Debt / EBITDA (Latest) ⓘ | 1.80 | 5.27 |
| Net Debt / Assets ⓘ | 28.78% | 37.76% |
| EBITDA / Interest ⓘ | 8.33 | 4.10 |
| Operating Margin (Latest) ⓘ | 35.57% | 35.29% |
| Operating Margin (5Y Median) ⓘ | 42.92% | 37.31% |
| Debt to Equity (Latest) ⓘ | 72.14% | 88.87% |
| Profit Margin (Latest) ⓘ | 22.46% | 19.61% |
| Free Cash Flow (Latest) ⓘ | $215.26M | |
Momentum (Price trend) | ||
| 3Y Return ⓘ | +36.32% | +30.75% |
| 12M Return (excl. last month) ⓘ | +24.76% | +4.36% |
| 6M Return ⓘ | +1.64% | -2.52% |
| Price vs. 200-Day MA ⓘ | +3.60% | -2.34% |
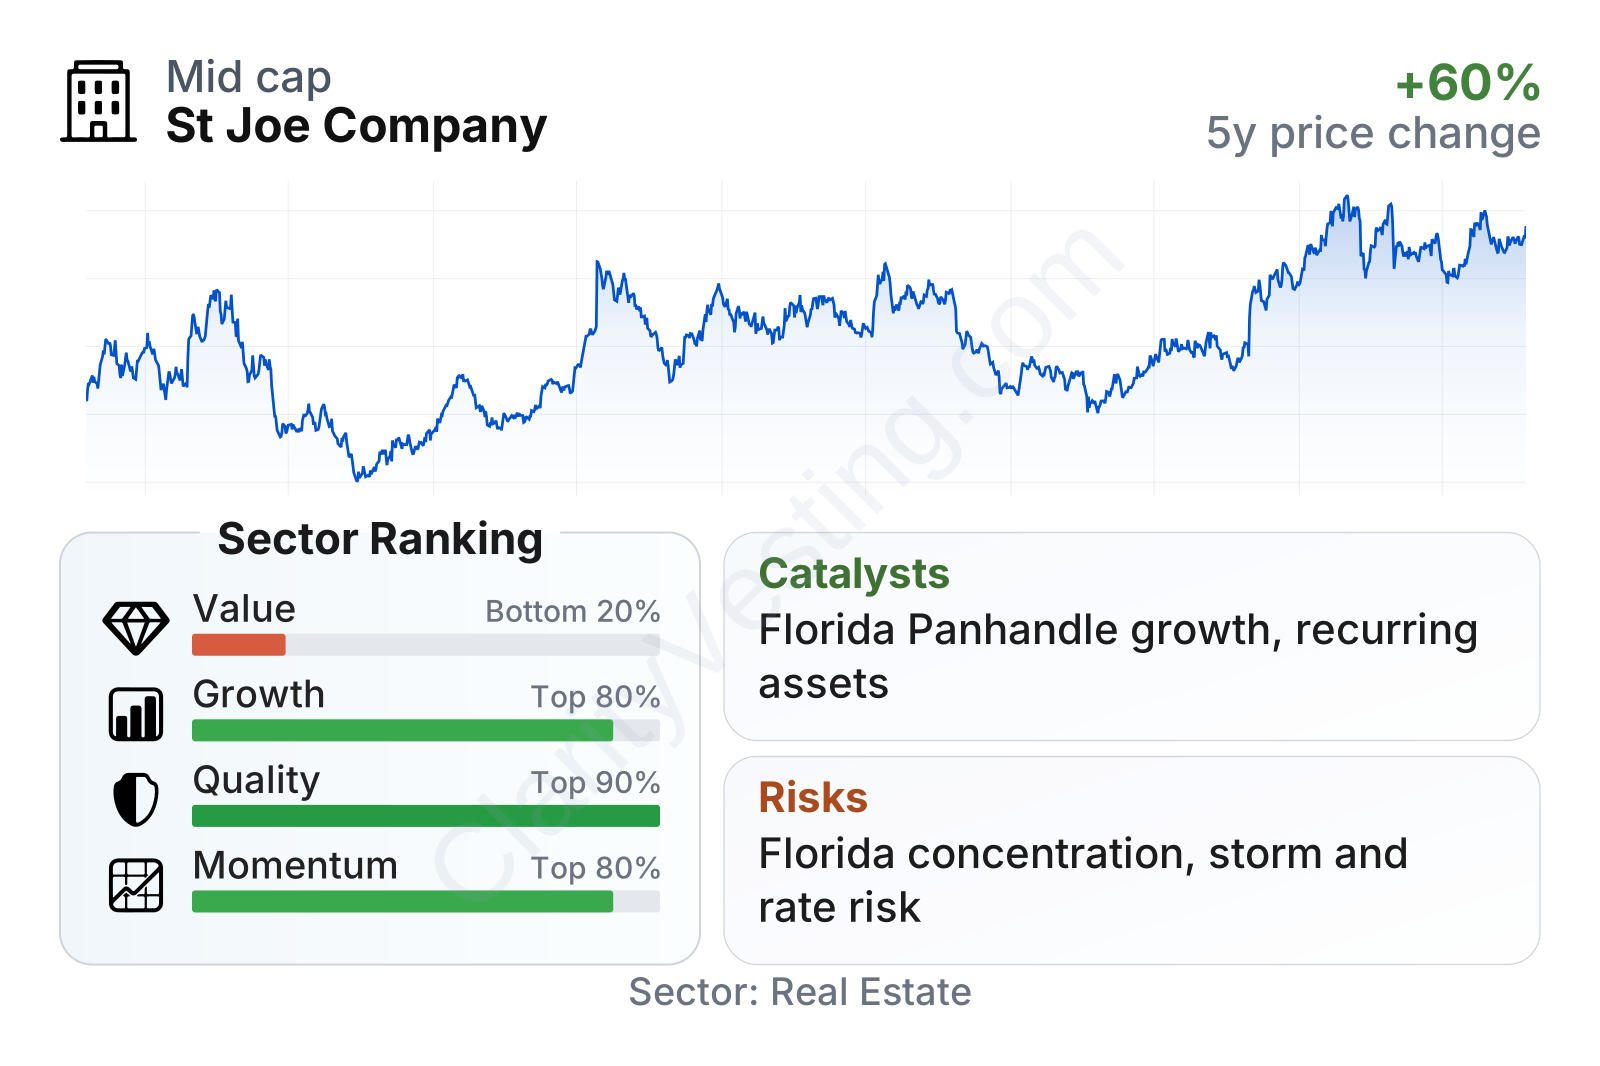
St. Joe stands out for business quality more than for traditional cheapness. Profitability, returns on capital, and balance sheet leverage all look stronger than much of the real estate sector. Growth metrics are also favorable, especially on revenue and book value per share. The weaker point is valuation: the stock trades at noticeably higher earnings and book multiples than the sector median, so the market is already recognizing part of that quality.
The share price history also shows a stock that can move sharply. It has recovered strongly from prior drawdowns and has outperformed the sector over the last year, but the path has not been smooth. That is consistent with a company whose results are influenced by real estate cycles, project timing, and changing expectations around Florida growth.
Growth
St. Joe operates in a part of the market that still has long-term structural support. Florida has benefited for years from population inflows, business relocations, and demand for second homes, retirement communities, and tourism infrastructure. Northwest Florida is not as internationally visible as South Florida, but it has gained from domestic migration, military presence, road and airport access, and relatively lower costs compared with some other coastal Florida markets.
The company’s strategy is logical for long-duration growth because it links land ownership with staged development. Rather than monetizing everything quickly, St. Joe can sell selected parcels while also keeping some assets for recurring rental, lodging, and amenity income. That approach can create a flywheel: more rooftops support more retail and hospitality demand, which can then raise surrounding land values and support future phases.
Revenue per share has trended up strongly over the last five years, with a particularly large step-up after 2022. That suggests growth has come from genuine business expansion rather than from financial engineering.
The dividend has also risen steadily, although the yield remains low. For a company in build-out mode, that pattern points more to gradual income growth than to a high current payout profile.
A meaningful catalyst is the depth of St. Joe’s land inventory. The company has a long runway to add residential communities, apartments, hotels, and commercial space without needing to assemble land at today’s market prices. In real estate, that embedded option value can matter a lot when regional demand stays healthy.
Another catalyst is continued expansion of recurring-income assets. More apartments, hospitality properties, retail centers, and marinas can make results less dependent on one-time land sales. That matters because recurring revenue usually supports a more stable earnings base over time.
Recent company updates have also highlighted continued development activity across residential, lodging, and commercial projects in the Florida Panhandle. That does not guarantee smooth results each quarter, but it does support the idea that the platform is still in active expansion rather than maturity.
Risks
This article is for informational purposes only and does not constitute financial advice. Some content is AI-generated. See Disclaimer


