Stock Analysis · EastGroup Properties Inc (EGP)
Overview
EastGroup Properties Inc is an industrial real estate investment trust, or REIT. In simple terms, it owns, develops, and operates warehouses and distribution buildings, mainly in fast-growing Sunbelt markets across the United States. Its properties are generally designed for businesses that need space for storage, light assembly, and local or regional distribution. The company focuses heavily on what it calls business distribution space, which usually serves customers moving goods within metropolitan areas rather than massive national logistics hubs.
Its revenue comes primarily from rental income generated by its portfolio of industrial properties. Based on recent company reporting, the mix is concentrated in a small number of recurring sources:
- Rental revenue from operating properties: approximately 95% to 97% of total revenue. This is the core business and includes rent paid by tenants leasing warehouse and distribution space.
- Income from tenant recoveries and related property revenue: approximately 2% to 4%. This generally includes reimbursements for property operating costs and other lease-related charges.
- Other revenue, including land sales or incidental items: typically a low-single share of revenue and more variable from period to period.
The business model is straightforward: acquire land in targeted markets, develop modern industrial buildings, lease them to many tenants, collect rent, and recycle capital into new projects. That makes EastGroup less dependent on a few very large customers than some logistics-focused landlords.
Over the last several years, revenue, operating income, and net income have moved higher, while administrative costs have remained relatively controlled. That pattern suggests scale benefits: as the property base grows, a meaningful share of additional rent flows through to profit.
The long-term direction is favorable, with total revenue rising steadily from a little over $400 million in 2021 to more than $700 million by 2025, alongside improving operating earnings. One unusual break in gross profit in 2025 appears tied to cost classification rather than a collapse in profitability, since operating income and net income still improved.
Key Figures
| Metric | Value | Sector ⓘ |
|---|---|---|
| Date | Oct 17, 2026 | |
| Context | ||
| Sector | Real Estate | |
| Industry | REIT - Industrial | |
| Market Cap ⓘ | $10.46B | |
| Beta ⓘ | 1.02 | |
Value (Cheapness) | ||
| P/E Ratio ⓘ | 34.66 | 17.38 |
| P/B Ratio ⓘ | 2.93 | 0.85 |
| FCF Yield ⓘ | 3.58% | 7.38% |
| Dividend Yield ⓘ | 3.31% | 4.85% |
| EBIT / EV ⓘ | 2.68% | 3.78% |
| PEG ⓘ | 8.42 | |
Growth (Business expansion) | ||
| Revenue Growth ⓘ | 9.10% | 5.30% |
| RPS Growth (5Y CAGR) ⓘ | 7.44% | 6.02% |
| EPS Growth (5Y CAGR) ⓘ | 1.99% | -11.37% |
| BVPS Growth (5Y CAGR) ⓘ | 13.92% | 0.45% |
| Margin Growth (5Y Trend) ⓘ | 1.78% | -0.22% |
| FCF Growth (5Y CAGR) ⓘ | 16.06% | 5.40% |
| DPS Growth (5Y CAGR) ⓘ | 14.79% | 5.02% |
Quality (Business durability) | ||
| ROIC (Latest) ⓘ | 5.10% | 5.69% |
| ROE (Latest) ⓘ | 8.61% | 7.56% |
| ROA (Latest) ⓘ | 5.60% | 2.85% |
| ROIC (5Y Median) ⓘ | 4.36% | 4.22% |
| ROE (5Y Median) ⓘ | 8.79% | 6.03% |
| ROA (5Y Median) ⓘ | 4.90% | 2.44% |
| Net Debt / EBIT (Latest) ⓘ | 4.89 | 7.59 |
| Net Debt / EBIT (5Y Median) ⓘ | 7.40 | 8.40 |
| Net Debt / EBITDA (Latest) ⓘ | 2.93 | 5.27 |
| Net Debt / Assets ⓘ | 29.60% | 37.76% |
| EBITDA / Interest ⓘ | 17.25 | 4.10 |
| Operating Margin (Latest) ⓘ | 44.44% | 35.29% |
| Operating Margin (5Y Median) ⓘ | 38.63% | 37.31% |
| Debt to Equity (Latest) ⓘ | 46.67% | 88.87% |
| Profit Margin (Latest) ⓘ | 40.57% | 19.61% |
| Free Cash Flow (Latest) ⓘ | $374.24M | |
Momentum (Price trend) | ||
| 3Y Return ⓘ | +27.79% | +30.75% |
| 12M Return (excl. last month) ⓘ | +23.19% | +4.36% |
| 6M Return ⓘ | +1.13% | -2.52% |
| Price vs. 200-Day MA ⓘ | +0.08% | -2.34% |
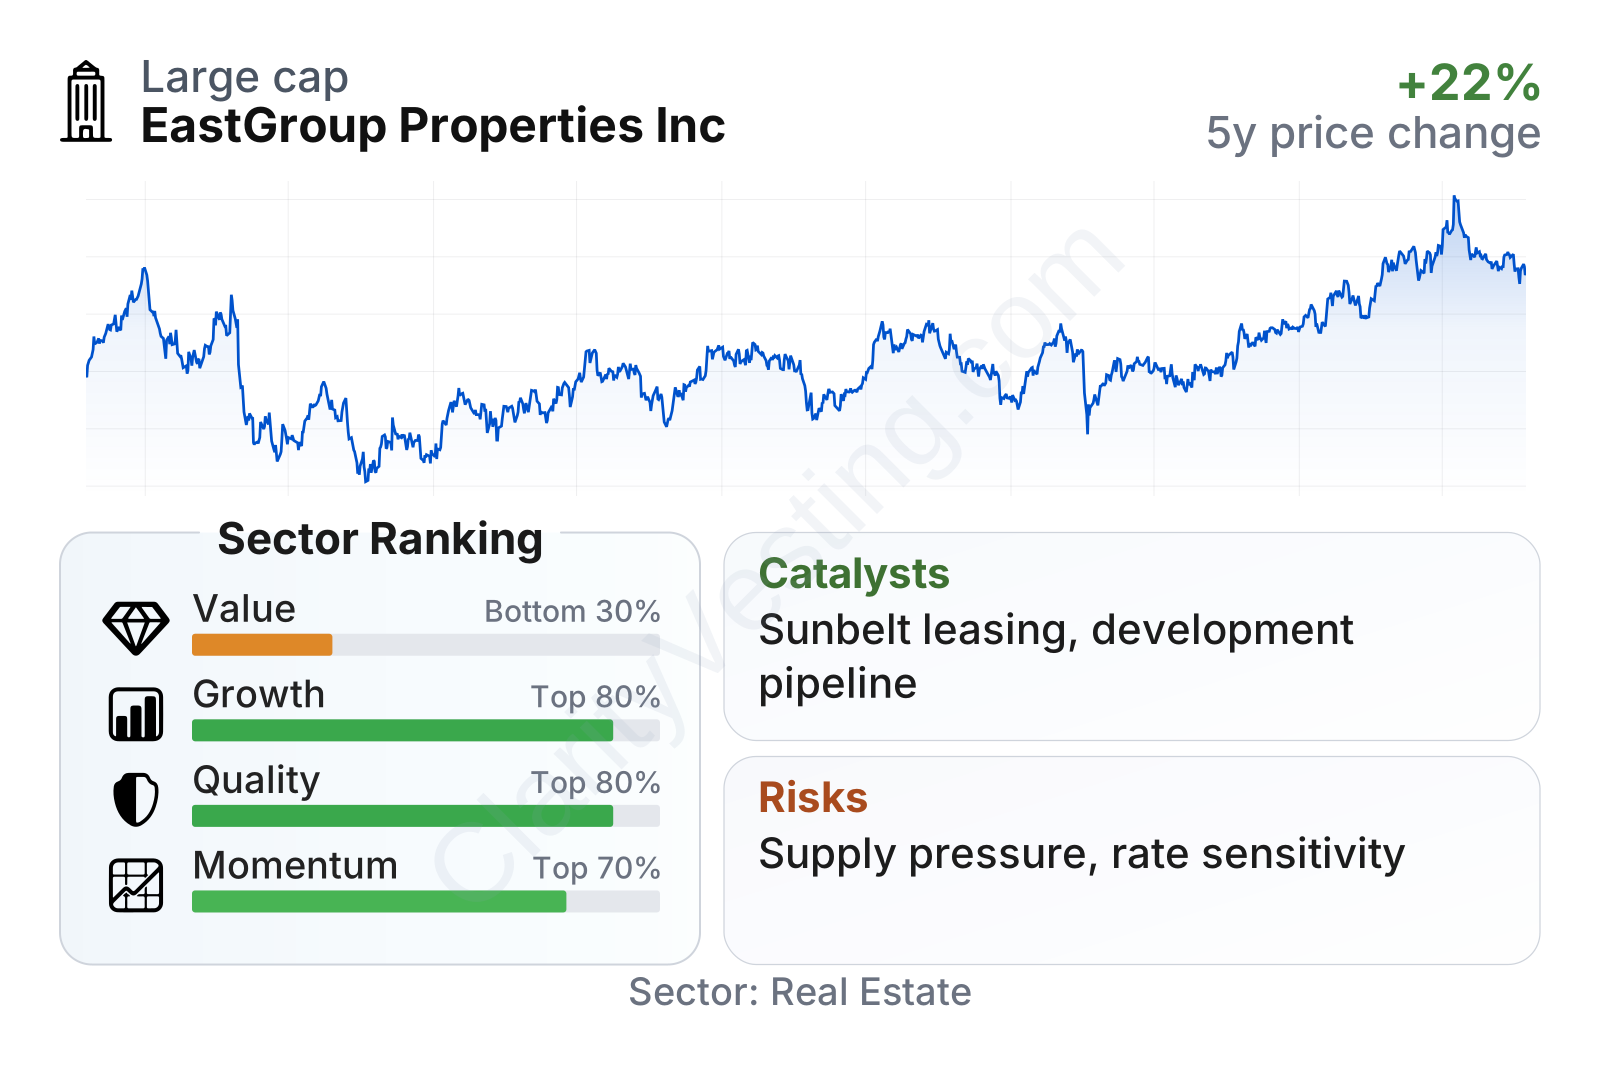
EastGroup is a large industrial REIT with a market value above $10 billion and share price volatility close to the broader market. The quality and growth profile stands out relative to most real estate peers: profitability, returns on assets, balance sheet strength, and growth rates are generally above sector norms. The weaker area is valuation, where the stock trades at clear premiums on earnings, book value, cash flow yield, and dividend yield versus the sector median. Recent price performance has also been stronger than the typical real estate stock, showing that the market has rewarded those fundamentals.
Growth
EastGroup operates in a part of real estate that still benefits from durable structural trends. Demand for industrial space has been supported by e-commerce, supply chain reconfiguration, population growth in the Sunbelt, and the need for faster delivery closer to end customers. Even when the broader economy slows, well-located infill warehouse space often remains strategically important because replacing it is difficult and land near major cities is limited.
The company’s strategy is coherent for long-term expansion. It concentrates on high-growth states such as Texas, Florida, Arizona, California, and North Carolina, where population and business formation have generally outpaced the national average. It also focuses on smaller-bay industrial properties, a niche that can be more fragmented and less directly exposed to the largest national tenants. That can help occupancy resilience because the tenant base is diversified across many local and regional businesses.
Revenue per share has advanced consistently over the last five years, which is important because it shows the company has not relied only on issuing more shares to grow. Per-share expansion has been solid rather than explosive, but it has been persistent, and that consistency matters in real estate.
Dividend per share has also moved steadily higher, with five-year growth well ahead of the sector median. For a REIT, that usually signals confidence in recurring cash generation. The current yield is not especially high compared with many other real estate stocks, but the growth rate has been notably stronger.
Recent company updates have continued to emphasize development starts, lease-up activity, and the strength of its Sunbelt pipeline. A meaningful catalyst is the combination of internal rent growth on existing leases and externally funded development deliveries. If industrial supply in several markets normalizes after a heavy construction cycle, landlords with proven sites and balance sheet capacity could be in a strong position to capture the next phase of demand.
Risks
This article is for informational purposes only and does not constitute financial advice. Some content is AI-generated. See Disclaimer


