Stock Analysis · LTC Properties Inc (LTC)
Overview
LTC Properties is a healthcare real estate investment trust, or REIT. In simple terms, it owns senior housing and skilled nursing properties and earns income mainly by leasing those buildings to operators or by providing mortgage financing backed by healthcare real estate. Its portfolio is focused on long-term care and housing for older adults, a niche tied closely to aging population trends in the United States.
The business is built around two main property types: senior housing communities, which typically include assisted living, independent living, and memory care, and skilled nursing facilities, which provide more intensive medical and rehabilitation services. LTC does not generally run these properties itself. Instead, it relies on third-party operators, so its results depend heavily on tenant health, rent collection, and property occupancy.
Based on the company’s recent filings, revenue is generated primarily from rental income and interest income from real estate loans and financing receivables. A practical breakdown is:
- Rental and related income: approximately 75% to 85% of total revenue. This comes from properties leased to senior housing and skilled nursing operators under long-term lease structures.
- Interest income from mortgage loans and financing receivables: approximately 15% to 25% of total revenue. This includes loans LTC has made to operators or owners, secured by healthcare properties.
Within the real estate portfolio itself, senior housing has become the larger strategic focus, while skilled nursing remains an important part of the asset base and revenue stream. That mix matters because senior housing can offer stronger growth when occupancy improves, while skilled nursing can offer steadier demand but faces more policy and reimbursement pressure.
LTC is a mid-sized REIT rather than an industry giant. That gives it enough scale to access capital markets and diversify across operators, but it is still much smaller than the largest healthcare REITs, which can limit negotiating power and diversification compared with top-tier peers.
The profitability profile has improved over the last several years. Revenue rose from about $155 million in 2021 to roughly $263 million in 2025, while net income also moved higher overall despite some volatility in between. That suggests the company has been rebuilding earnings power after a more difficult period for healthcare real estate.
The income flow shows a business with rising revenue and solid operating income, while interest expense remains meaningful but manageable. One notable point is that 2025 included a sharp jump in cost of revenue, so investors will want to distinguish between recurring earnings strength and one-time or transitional items.
Key Figures
| Metric | Value | Sector ⓘ |
|---|---|---|
| Date | Oct 17, 2026 | |
| Context | ||
| Sector | Real Estate | |
| Industry | REIT - Healthcare Facilities | |
| Market Cap ⓘ | $2.33B | |
| Beta ⓘ | 0.54 | |
Value (Cheapness) | ||
| P/E Ratio ⓘ | 15.43 | 17.38 |
| P/B Ratio ⓘ | 1.89 | 0.85 |
| FCF Yield ⓘ | -1.29% | 7.38% |
| Dividend Yield ⓘ | 5.31% | 4.85% |
| EBIT / EV ⓘ | 5.97% | 3.78% |
| PEG ⓘ | 5.74 | |
Growth (Business expansion) | ||
| Revenue Growth ⓘ | 65.50% | 5.30% |
| RPS Growth (5Y CAGR) ⓘ | 9.22% | 6.02% |
| EPS Growth (5Y CAGR) ⓘ | -8.34% | -11.37% |
| BVPS Growth (5Y CAGR) ⓘ | 3.04% | 0.45% |
| Margin Growth (5Y Trend) ⓘ | 6.81% | -0.22% |
| FCF Growth (5Y CAGR) ⓘ | 10.51% | 5.40% |
| DPS Growth (5Y CAGR) ⓘ | -0.05% | 5.02% |
Quality (Business durability) | ||
| ROIC (Latest) ⓘ | 9.31% | 5.69% |
| ROE (Latest) ⓘ | 13.07% | 7.56% |
| ROA (Latest) ⓘ | 6.42% | 2.85% |
| ROIC (5Y Median) ⓘ | 8.23% | 4.22% |
| ROE (5Y Median) ⓘ | 10.79% | 6.03% |
| ROA (5Y Median) ⓘ | 5.11% | 2.44% |
| Net Debt / EBIT (Latest) ⓘ | 4.08 | 7.59 |
| Net Debt / EBIT (5Y Median) ⓘ | 5.74 | 8.40 |
| Net Debt / EBITDA (Latest) ⓘ | 3.28 | 5.27 |
| Net Debt / Assets ⓘ | 33.95% | 37.76% |
| EBITDA / Interest ⓘ | 5.69 | 4.10 |
| Operating Margin (Latest) ⓘ | 52.03% | 35.29% |
| Operating Margin (5Y Median) ⓘ | 64.44% | 37.31% |
| Debt to Equity (Latest) ⓘ | 61.45% | 88.87% |
| Profit Margin (Latest) ⓘ | 39.85% | 19.61% |
| Free Cash Flow (Latest) ⓘ | -$30.10M | |
Momentum (Price trend) | ||
| 3Y Return ⓘ | +61.03% | +30.75% |
| 12M Return (excl. last month) ⓘ | +27.43% | +4.36% |
| 6M Return ⓘ | +12.62% | -2.52% |
| Price vs. 200-Day MA ⓘ | +13.26% | -2.34% |
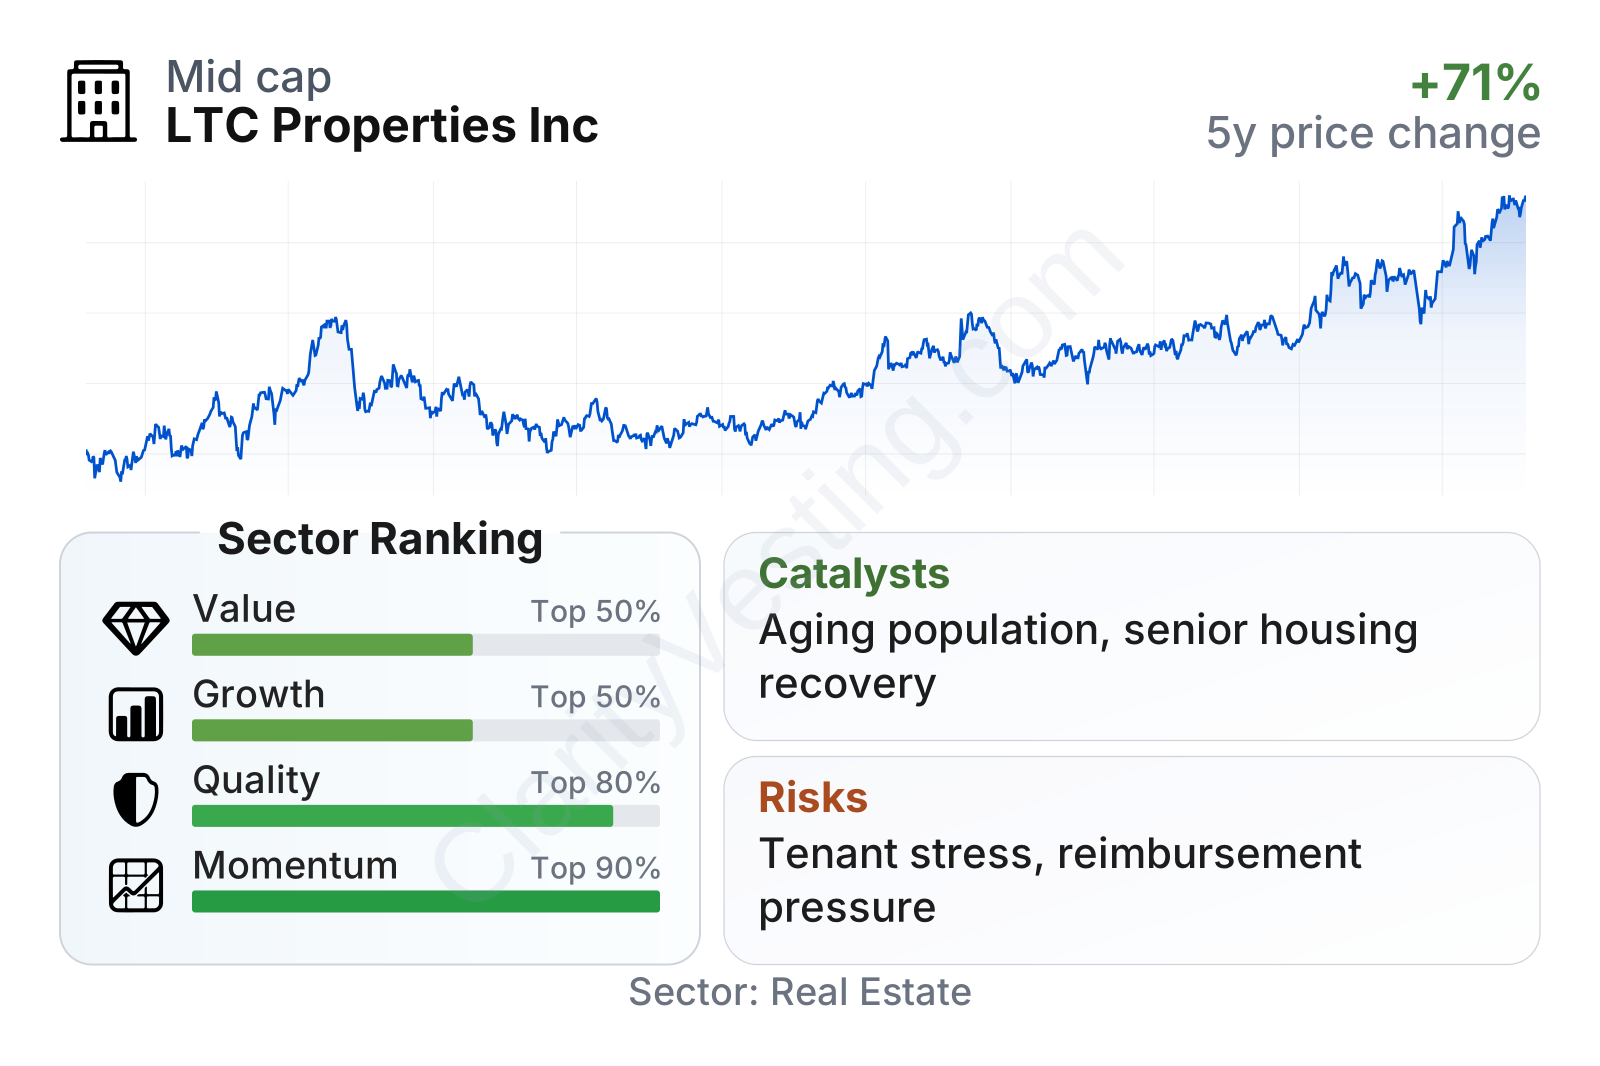
The overall picture is mixed but constructive. On valuation, LTC trades at an earnings multiple slightly below the sector median, but at a price-to-book multiple clearly above the sector median, which shows the market is paying up for asset quality and business stability. On quality, profitability and balance-sheet measures are stronger than many peers, with better returns on assets and lower leverage than the typical healthcare property REIT. Growth metrics also look stronger than the sector median, especially on revenue-related measures, although dividend growth has been mostly flat. Momentum is favorable, with the shares outperforming much of the sector over multiple time frames.
LTC also stands out for its low beta of about 0.58, meaning its stock has historically moved less than the broader market. That can be relevant for a healthcare REIT whose appeal often comes from income, steady asset cash flow, and lower share-price volatility rather than rapid expansion.
Growth
LTC operates in a sector with a credible long-term demand backdrop. The aging U.S. population is the clearest structural support. As more people move into the 80-plus age bracket over time, demand for assisted living, memory care, rehabilitation, and long-term nursing services should increase. That does not guarantee smooth results each year, but it creates a favorable demand foundation for healthcare landlords with the right properties and operators.
The company’s strategy also makes sense for this environment. Rather than trying to be the largest player, LTC has focused on selective investments, operator relationships, portfolio recycling, and a mix of leases and financing structures. That can help it adapt to changing conditions. If one area of the market becomes less attractive, the company can shift capital between acquisitions, development funding, mortgage lending, and asset sales.
Revenue per share has trended upward over the last five years, with only a brief pause before a stronger step-up in 2025. That is an encouraging sign because it means growth has not come only from issuing more shares; the business has also increased revenue on a per-share basis.
The dividend per share has been stable rather than fast-growing. For a REIT, that stability matters, but it also shows that management has been cautious about raising payouts aggressively. In a sector that went through tenant stress and higher interest rates, a flat dividend can be interpreted as balance-sheet discipline rather than weakness alone.
A meaningful recent catalyst is the continued normalization in senior housing operating conditions. Across the industry, occupancy recovery has improved property economics for operators, which can strengthen rent coverage and create room for LTC to deploy more capital. The company has also discussed investment activity and restructuring efforts in recent filings and investor materials, pointing to a portfolio that is being actively managed instead of simply maintained.
Another potential tailwind is the financing environment. If borrowing costs stabilize or decline, acquisition economics and property values can become more supportive. That would help a REIT like LTC, which relies on spreads between property yields, financing costs, and operator health.
Risks
This article is for informational purposes only and does not constitute financial advice. Some content is AI-generated. See Disclaimer


