Stock Analysis · Lamar Advertising Company (LAMR)
Overview
Lamar Advertising Company is one of the largest outdoor advertising owners and operators in North America. It leases, owns, and manages advertising space on billboards, logo signs, and transit displays, then sells that space to local businesses, regional advertisers, and national brands. The business is organized as a real estate investment trust, or REIT, but operationally it behaves like a media platform built on a large network of physical locations.
The company’s revenue is heavily concentrated in billboard advertising. Based on recent annual disclosures, the mix is approximately:
- Billboards: about 89% of revenue. This includes traditional static billboards and digital billboards, which can rotate multiple ads on the same screen and usually carry higher revenue per location.
- Logo signs: about 6% of revenue. These are the blue highway signs that direct drivers to gas stations, restaurants, hotels, and similar businesses near exits.
- Transit advertising: about 5% of revenue. This includes displays on buses, shelters, benches, and airport-related or other public transportation locations.
Lamar’s footprint is broad, with operations across the United States and Canada, and a particularly strong position in local and regional advertising markets. That local focus matters because small and mid-sized businesses often value nearby physical visibility, and outdoor ads can remain effective even when digital advertising markets become crowded or more expensive.
Over the last several years, revenue has grown steadily overall, while profitability has remained solid. Operating results can fluctuate with political advertising cycles, acquisitions, and the mix between static and digital displays, but the basic model is straightforward: a large installed asset base, recurring lease income from ad space, and opportunities to improve returns by converting select locations to digital formats.
The business has generally expanded revenue since 2021, and profit conversion has remained healthy despite periods of higher interest expense. The 2024 dip in net income stands out against otherwise steady top-line progress, which suggests that investors should pay attention not only to revenue growth but also to financing costs and expense control.
Key Figures
| Metric | Value | Sector ⓘ |
|---|---|---|
| Date | Oct 04, 2026 | |
| Context | ||
| Sector | Real Estate | |
| Industry | REIT - Specialty | |
| Market Cap ⓘ | $14.64B | |
| Beta ⓘ | 1.20 | |
Value (Cheapness) | ||
| P/E Ratio ⓘ | 26.30 | 17.35 |
| P/B Ratio ⓘ | 14.91 | 0.86 |
| FCF Yield ⓘ | 5.15% | 7.47% |
| Dividend Yield ⓘ | 4.40% | 4.75% |
| EBIT / EV ⓘ | 3.54% | 3.81% |
| PEG ⓘ | 2.20 | |
Growth (Business expansion) | ||
| Revenue Growth ⓘ | 6.50% | 5.30% |
| RPS Growth (5Y CAGR) ⓘ | 6.04% | 5.96% |
| EPS Growth (5Y CAGR) ⓘ | -7.08% | -11.41% |
| BVPS Growth (5Y CAGR) ⓘ | -4.90% | 0.41% |
| Margin Growth (5Y Trend) ⓘ | 6.01% | 0.53% |
| FCF Growth (5Y CAGR) ⓘ | 4.88% | 5.40% |
| DPS Growth (5Y CAGR) ⓘ | 12.73% | 5.02% |
Quality (Business durability) | ||
| ROIC (Latest) ⓘ | 15.37% | 5.77% |
| ROE (Latest) ⓘ | 55.56% | 7.64% |
| ROA (Latest) ⓘ | 8.04% | 2.85% |
| ROIC (5Y Median) ⓘ | 12.85% | 4.20% |
| ROE (5Y Median) ⓘ | 36.33% | 6.03% |
| ROA (5Y Median) ⓘ | 7.01% | 2.45% |
| Net Debt / EBIT (Latest) ⓘ | 7.05 | 7.57 |
| Net Debt / EBIT (5Y Median) ⓘ | 7.90 | 8.41 |
| Net Debt / EBITDA (Latest) ⓘ | 4.75 | 5.12 |
| Net Debt / Assets ⓘ | 70.10% | 37.84% |
| EBITDA / Interest ⓘ | 6.40 | 4.11 |
| Operating Margin (Latest) ⓘ | 29.95% | 35.40% |
| Operating Margin (5Y Median) ⓘ | 28.72% | 36.59% |
| Debt to Equity (Latest) ⓘ | 500.11% | 89.06% |
| Profit Margin (Latest) ⓘ | 23.91% | 19.99% |
| Free Cash Flow (Latest) ⓘ | $754.36M | |
Momentum (Price trend) | ||
| 3Y Return ⓘ | +108.77% | +30.66% |
| 12M Return (excl. last month) ⓘ | +27.24% | +7.55% |
| 6M Return ⓘ | +15.39% | +0.69% |
| Price vs. 200-Day MA ⓘ | +3.24% | -2.27% |
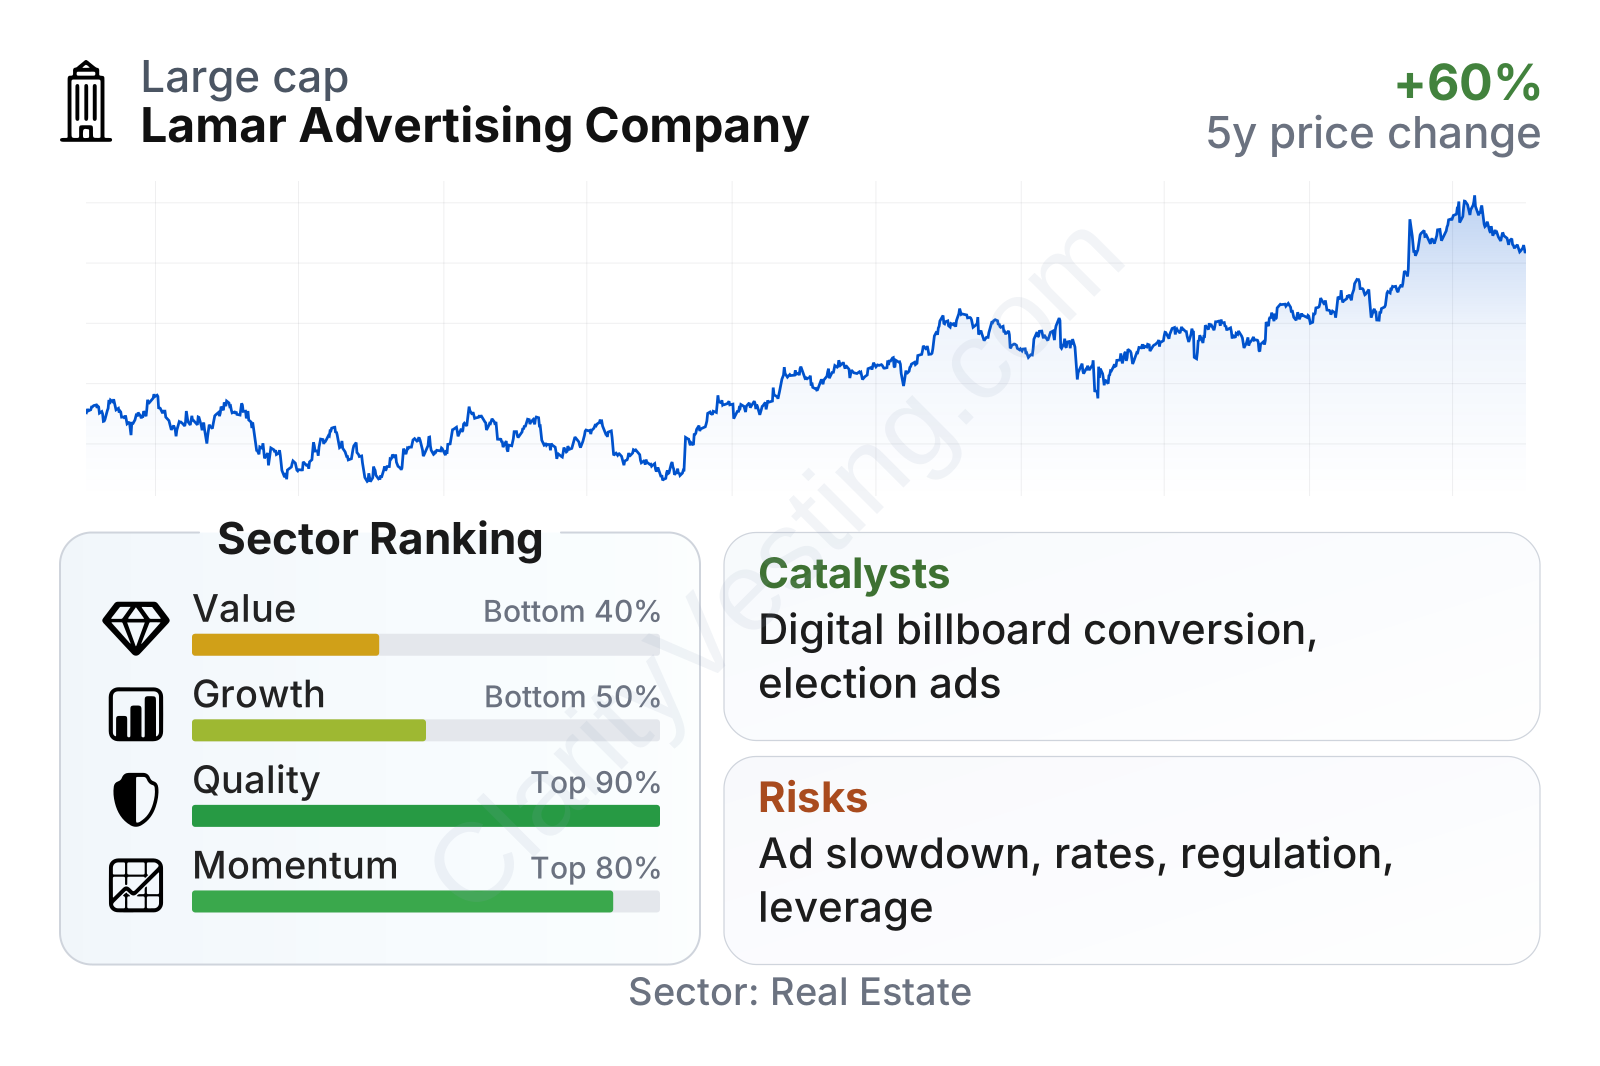
Lamar stands out for business quality more than for cheapness. Profitability and capital returns are well above much of the real estate sector, with returns on assets and invested capital notably stronger than typical REIT levels. Growth is more mixed: revenue trends have been respectable, and dividend growth has been strong over five years, but the valuation profile is less attractive relative to the sector, with earnings and book-based multiples sitting well above median levels.
The stock’s recent market performance has also been strong. Over one, three, and six-month comparison periods, momentum has outpaced much of the sector, which often reflects confidence in the company’s asset base, cash generation, and pricing power. At the same time, a beta modestly above 1 suggests the shares can still move more than the broader market during periods of stress.
Growth
Outdoor advertising is a mature industry, but it is not a stagnant one. The key growth angle for Lamar is less about entering a brand-new market and more about improving the economics of a large existing network. The strongest long-term driver is digital conversion. When a traditional billboard becomes digital, Lamar can display multiple advertisers in rotation, adjust campaigns faster, and often earn more revenue from the same location. That gives the company a practical way to grow without needing a proportional increase in physical inventory.
Another reason the strategy makes sense is the resilience of local advertising demand. Many businesses still need high-visibility awareness near stores, highways, and commuting routes. Outdoor ads are also harder to skip than many online formats, which helps preserve their relevance. In addition, logo signs and transit assets provide supplementary revenue streams that are tied to real-world traffic and business activity.
Revenue per share has moved upward at a steady pace over the last five years, which is a useful sign because it shows growth on a per-share basis rather than only through asset accumulation. That trend supports the view that Lamar has been improving the earning power of its platform over time.
The dividend trend has also been strong overall, even though one data point appears distorted by an unusually low reported figure. Looking at the broader pattern, distributions have risen meaningfully in recent years, which is consistent with stronger cash generation and with the REIT structure, where returning cash to shareholders is a central part of the model.
A meaningful catalyst comes from political advertising cycles. Election years can create a temporary but material boost for billboard demand in many markets. More structurally, acquisitions of smaller operators and selective expansion of digital inventory can add to long-term growth. Recent company communications have also emphasized continued strength in programmatic and national advertising channels, which may help Lamar monetize its inventory more efficiently over time.
Risks
This article is for informational purposes only and does not constitute financial advice. Some content is AI-generated. See Disclaimer


