Stock Analysis · EPR Properties (EPR-PG)
Overview
EPR Properties is a real estate investment trust, or REIT, focused on owning specialized experiential properties. In simple terms, it buys properties where people go to spend time and money on leisure and entertainment, then leases those properties to operators. The company also owns some education-related real estate, but its portfolio is now much more centered on experiences than on traditional property categories such as offices or apartments.
Its business model is straightforward: tenants pay rent under long-term leases, and EPR uses that rental income to cover property costs, interest expense, dividends, and new investments. Because it is a REIT, cash generation, occupancy, tenant health, and access to financing matter more than product innovation or manufacturing efficiency.
Based on recent company reporting, revenue is mainly generated from rental income tied to experiential real estate, with a smaller contribution from education properties and from financing-related income such as mortgage notes or sales-type leases. The portfolio is concentrated in a few identifiable categories.
- Theaters: approximately 35% to 40% of total revenue. This includes megaplex movie theater properties leased to major operators.
- Eat & play, attractions, and other experiential assets: approximately 30% to 35%. This includes categories such as family entertainment centers, ski, attraction venues, fitness and wellness, and similar destination-based properties.
- Experiential lodging and gaming-related assets: approximately 10% to 15%, depending on period and property mix.
- Education: approximately 10% to 15%. This primarily includes private schools and early childhood education facilities.
- Other revenue and financing income: generally a low-single share of total revenue, coming from items such as percentage rent, interest income, and lease-related structures.
The important point for long-term analysis is that EPR is not a broad REIT. It is a niche landlord with meaningful exposure to out-of-home entertainment spending. That makes the company easier to understand, but also more sensitive to shifts in consumer habits and tenant performance than a highly diversified property owner.
Over the last several years, revenue has generally moved upward, and operating income has remained strong relative to sales. The one figure that looks unusual in the latest annual flow is cost structure distortion from accounting items rather than a collapse in the underlying rental model. At a high level, the business still shows the classic REIT pattern of high property-level margins, meaningful interest expense, and solid net income conversion when portfolio performance is stable.
Key Figures
| Metric | Value | Sector ⓘ |
|---|---|---|
| Date | Oct 17, 2026 | |
| Context | ||
| Sector | Real Estate | |
| Industry | REIT - Specialty | |
| Market Cap ⓘ | $4.65B | |
| Beta ⓘ | 1.02 | |
Value (Cheapness) | ||
| P/E Ratio ⓘ | 12.93 | 17.38 |
| P/B Ratio ⓘ | 0.66 | 0.85 |
| FCF Yield ⓘ | 5.03% | 7.38% |
| Dividend Yield ⓘ | 18.23% | 4.85% |
| EBIT / EV ⓘ | 8.10% | 3.78% |
| PEG ⓘ | N/A | |
Growth (Business expansion) | ||
| Revenue Growth ⓘ | 10.60% | 5.30% |
| RPS Growth (5Y CAGR) ⓘ | 8.17% | 6.02% |
| EPS Growth (5Y CAGR) ⓘ | N/A | -11.37% |
| BVPS Growth (5Y CAGR) ⓘ | -3.44% | 0.45% |
| Margin Growth (5Y Trend) ⓘ | 10.20% | -0.22% |
| FCF Growth (5Y CAGR) ⓘ | 8.22% | 5.40% |
| DPS Growth (5Y CAGR) ⓘ | 24.69% | 5.02% |
Quality (Business durability) | ||
| ROIC (Latest) ⓘ | 7.57% | 5.69% |
| ROE (Latest) ⓘ | 11.35% | 7.56% |
| ROA (Latest) ⓘ | 4.54% | 2.85% |
| ROIC (5Y Median) ⓘ | 7.27% | 4.22% |
| ROE (5Y Median) ⓘ | 6.11% | 6.03% |
| ROA (5Y Median) ⓘ | 3.02% | 2.44% |
| Net Debt / EBIT (Latest) ⓘ | 8.64 | 7.59 |
| Net Debt / EBIT (5Y Median) ⓘ | 9.99 | 8.40 |
| Net Debt / EBITDA (Latest) ⓘ | 5.99 | 5.27 |
| Net Debt / Assets ⓘ | 57.97% | 37.76% |
| EBITDA / Interest ⓘ | 4.19 | 4.10 |
| Operating Margin (Latest) ⓘ | 55.58% | 35.29% |
| Operating Margin (5Y Median) ⓘ | 46.95% | 37.31% |
| Debt to Equity (Latest) ⓘ | 152.63% | 88.87% |
| Profit Margin (Latest) ⓘ | 35.63% | 19.61% |
| Free Cash Flow (Latest) ⓘ | $234.26M | |
Momentum (Price trend) | ||
| 3Y Return ⓘ | +34.84% | +30.75% |
| 12M Return (excl. last month) ⓘ | -2.49% | +4.36% |
| 6M Return ⓘ | +0.31% | -2.52% |
| Price vs. 200-Day MA ⓘ | -0.76% | -2.34% |
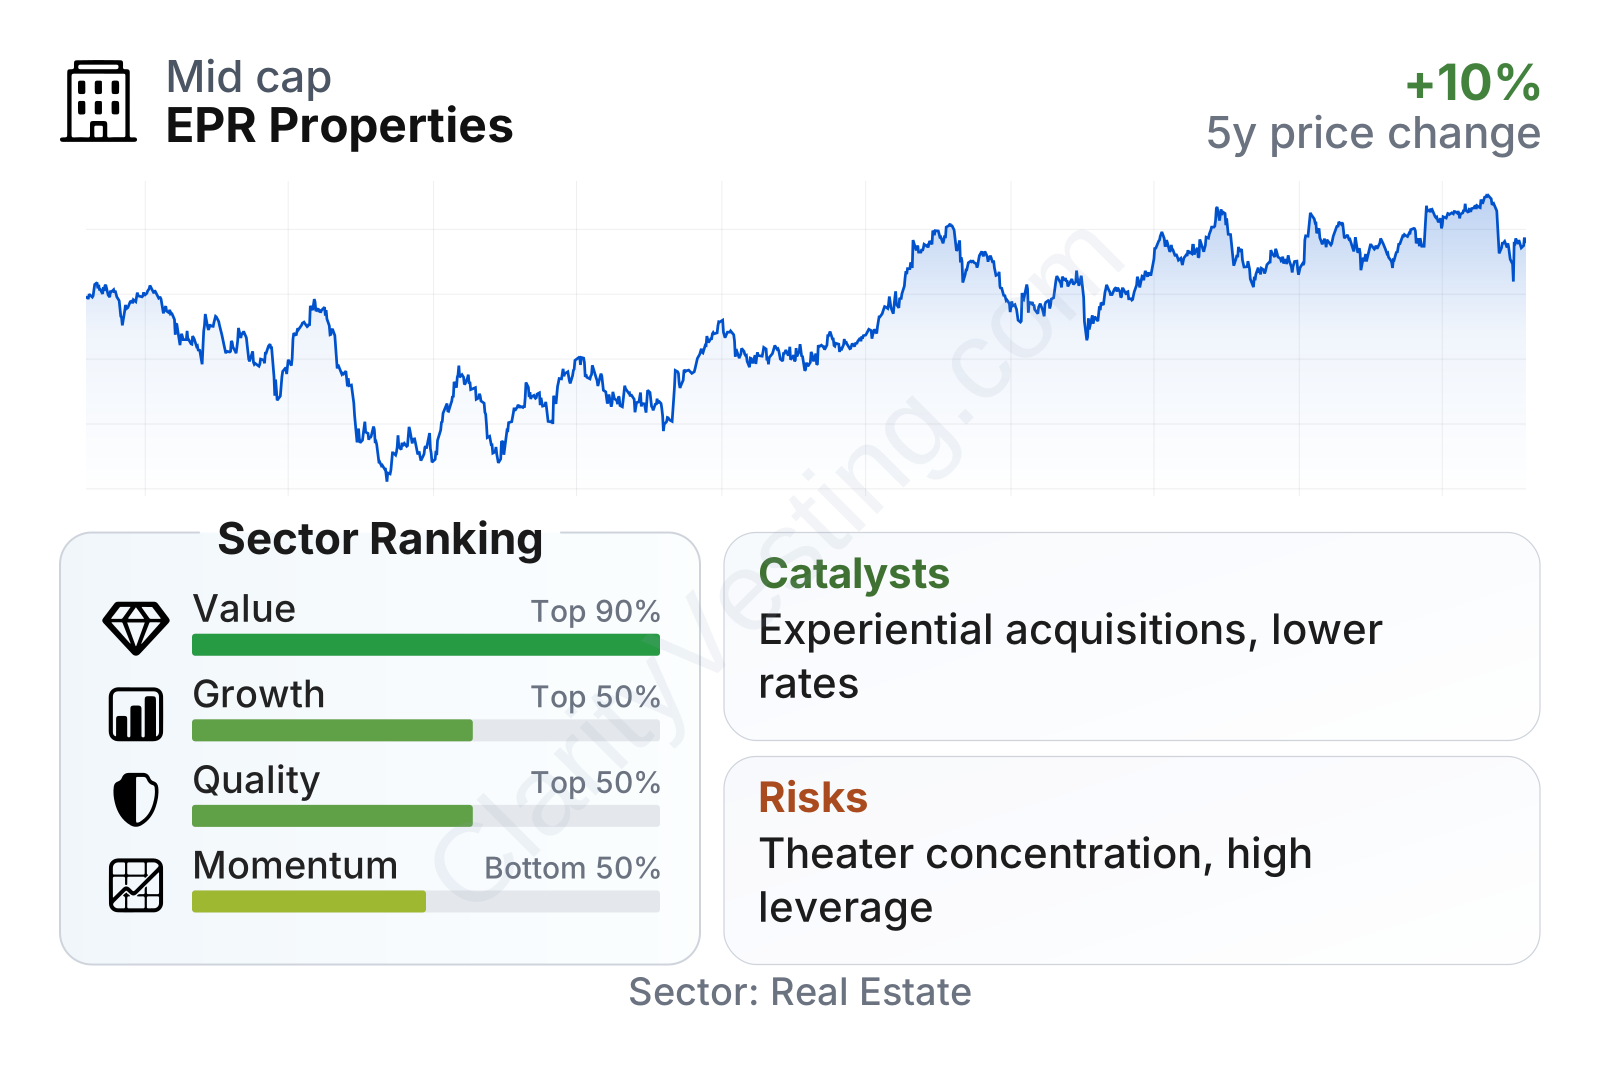
EPR sits in the mid-cap range within real estate and shows a mixed but understandable profile. On valuation, it screens cheaper than the sector on earnings and book value multiples, while its earnings yield measure is stronger than the sector median. Profitability is also solid for a REIT, with returns on assets, equity, and invested capital above typical sector levels and operating margins well ahead of many peers.
The weaker side of the picture is leverage. Net debt relative to EBITDA and assets is elevated versus the sector median, and debt-to-equity is materially higher as well. Interest coverage remains adequate rather than distressed, but it does not leave a huge margin for error if tenant performance weakens or refinancing costs rise. Growth metrics are generally favorable, especially revenue per share, free cash flow, and dividend growth over five years, although book value per share has trended down. Price performance has been less impressive recently, which helps explain why the stock still trades at a discount to many real estate peers.
Growth
EPR operates in a part of real estate tied to the experience economy, which has a credible long-term tailwind. Consumers have continued to spend on travel, recreation, attractions, dining, and destination-based leisure even as some traditional retail categories have matured. This does not make the sector immune to recessions, but it does give EPR exposure to properties that are harder to replace digitally than many older real estate formats.
The company’s strategy also makes sense in that context. Management has spent years reshaping the portfolio away from categories with weaker long-term visibility and toward properties where the tenant’s business depends on the location itself. A ski resort, water park, attraction venue, or experiential lodging asset is usually not interchangeable with a generic building. That can create better tenant stickiness and make the real estate more distinctive than commodity property types.
Revenue per share has generally risen over the last five years, despite a modest dip in 2024. That pattern suggests the portfolio has been expanding and recovering in a way that has more than offset dilution and asset turnover. The five-year growth pace is better than the sector median, which supports the idea that EPR has been rebuilding earnings power after the pandemic shock that hit entertainment properties especially hard.
The dividend path also tells an important part of the recovery. The annual dividend per share climbed sharply from the reduced pandemic-era base and has continued to edge higher. The current yield is extremely high relative to the broader real estate sector, which reflects both the company’s income-focused structure and the market’s caution around the durability of that payout. In other words, the dividend recovery is real, but the yield remains high because the stock still carries perceived risk.
Potential growth catalysts are fairly specific. New experiential acquisitions can add rent quickly if financed at attractive spreads. Additional diversification away from movie theaters could improve the market’s view of the business over time. If interest rates stabilize or decline, REIT financing conditions could also improve, helping acquisition economics and valuation multiples. Recent company communications have also emphasized active capital recycling and selective investment into experiential categories where supply is limited and replacement costs are high. That is a sensible approach for a specialized landlord trying to grow without stretching the balance sheet too far.
Risks
This article is for informational purposes only and does not constitute financial advice. Some content is AI-generated. See Disclaimer


