Stock Analysis · CBRE Group Inc (CBRE)
Overview
CBRE Group is one of the largest real estate services companies in the world. Rather than mainly owning buildings like a traditional real estate investment company, CBRE mostly earns money by helping property owners, occupiers, investors, and developers buy, sell, lease, finance, manage, value, and improve real estate. Its activities span office, industrial, logistics, retail, multifamily, hotels, data centers, and other property types across many countries.
The business is broad, but its revenue is mainly generated from service lines tied to commercial property activity and recurring property operations. Based on the company’s recent reporting structure, the largest revenue sources are approximately the following:
- Project Management – about 30% to 35% of revenue. This includes program management, construction management, and fit-out or workplace-related services for corporate and institutional clients.
- Property Management and related facilities services – about 20% to 25%. This covers managing buildings and portfolios for owners, often under longer-term contracts that can create steadier revenue.
- Leasing – about 15% to 20%. CBRE advises landlords and tenants on office, industrial, and other commercial leases. This business is more cyclical because it depends on market activity.
- Investment Sales – about 10% to 15%. This includes advising on property sales transactions, which tend to rise and fall with capital markets and investor appetite.
- Valuation and other advisory services – about 5% to 10%. These services include appraisals and consulting work.
- Loan origination and servicing, debt and structured finance – about 5% to 10%. This part benefits when financing markets are active.
- Real estate development and investment management-related activities – usually a smaller share of consolidated revenue, but they can still materially affect profit in certain periods.
That mix matters because CBRE is no longer just a brokerage firm. Over time it has built larger recurring service businesses such as project management, property management, and facilities outsourcing, which can help reduce dependence on transaction volumes.
Over the last several years, revenue has climbed from roughly the high-$20 billion range to above $40 billion, while profitability has been more uneven. Gross profit and operating income recovered in 2024 and 2025, but net income has not moved up as smoothly because of higher interest expense, cyclical market weakness in parts of commercial real estate, and integration costs tied to expansion.
The business flow shows a large service cost base, which is normal for a labor-intensive real estate services company. Revenue has expanded meaningfully over time, operating income has improved from the weaker 2023 period, and interest expense has become more noticeable, which explains why growth in net income has lagged revenue growth.
Key Figures
| Metric | Value | Sector ⓘ |
|---|---|---|
| Date | Oct 10, 2026 | |
| Context | ||
| Sector | Real Estate | |
| Industry | Real Estate Services | |
| Market Cap ⓘ | $36.94B | |
| Beta ⓘ | 1.23 | |
Value (Cheapness) | ||
| P/E Ratio ⓘ | 29.19 | 17.21 |
| P/B Ratio ⓘ | 5.11 | 0.86 |
| FCF Yield ⓘ | 2.54% | 7.55% |
| Dividend Yield ⓘ | N/A | 4.84% |
| EBIT / EV ⓘ | 4.15% | 3.81% |
| PEG ⓘ | 0.74 | |
Growth (Business expansion) | ||
| Revenue Growth ⓘ | 15.50% | 5.30% |
| RPS Growth (5Y CAGR) ⓘ | 13.35% | 6.02% |
| EPS Growth (5Y CAGR) ⓘ | -14.41% | -11.37% |
| BVPS Growth (5Y CAGR) ⓘ | 4.51% | 0.61% |
| Margin Growth (5Y Trend) ⓘ | -1.16% | 0.40% |
| FCF Growth (5Y CAGR) ⓘ | -14.48% | 5.35% |
| DPS Growth (5Y CAGR) ⓘ | -21.25% | 5.05% |
Quality (Business durability) | ||
| ROIC (Latest) ⓘ | 9.77% | 5.69% |
| ROE (Latest) ⓘ | 16.90% | 7.56% |
| ROA (Latest) ⓘ | 4.41% | 2.85% |
| ROIC (5Y Median) ⓘ | 10.13% | 4.21% |
| ROE (5Y Median) ⓘ | 14.68% | 6.03% |
| ROA (5Y Median) ⓘ | 4.58% | 2.44% |
| Net Debt / EBIT (Latest) ⓘ | 4.51 | 7.66 |
| Net Debt / EBIT (5Y Median) ⓘ | 3.02 | 8.42 |
| Net Debt / EBITDA (Latest) ⓘ | 3.05 | 5.27 |
| Net Debt / Assets ⓘ | 29.83% | 37.76% |
| EBITDA / Interest ⓘ | 15.20 | 4.10 |
| Operating Margin (Latest) ⓘ | 4.62% | 35.18% |
| Operating Margin (5Y Median) ⓘ | 4.48% | 37.31% |
| Debt to Equity (Latest) ⓘ | 125.95% | 88.87% |
| Profit Margin (Latest) ⓘ | 2.98% | 19.61% |
| Free Cash Flow (Latest) ⓘ | $938.00M | |
Momentum (Price trend) | ||
| 3Y Return ⓘ | +80.30% | +30.71% |
| 12M Return (excl. last month) ⓘ | -13.00% | +6.58% |
| 6M Return ⓘ | -8.01% | -1.74% |
| Price vs. 200-Day MA ⓘ | -9.31% | -3.29% |
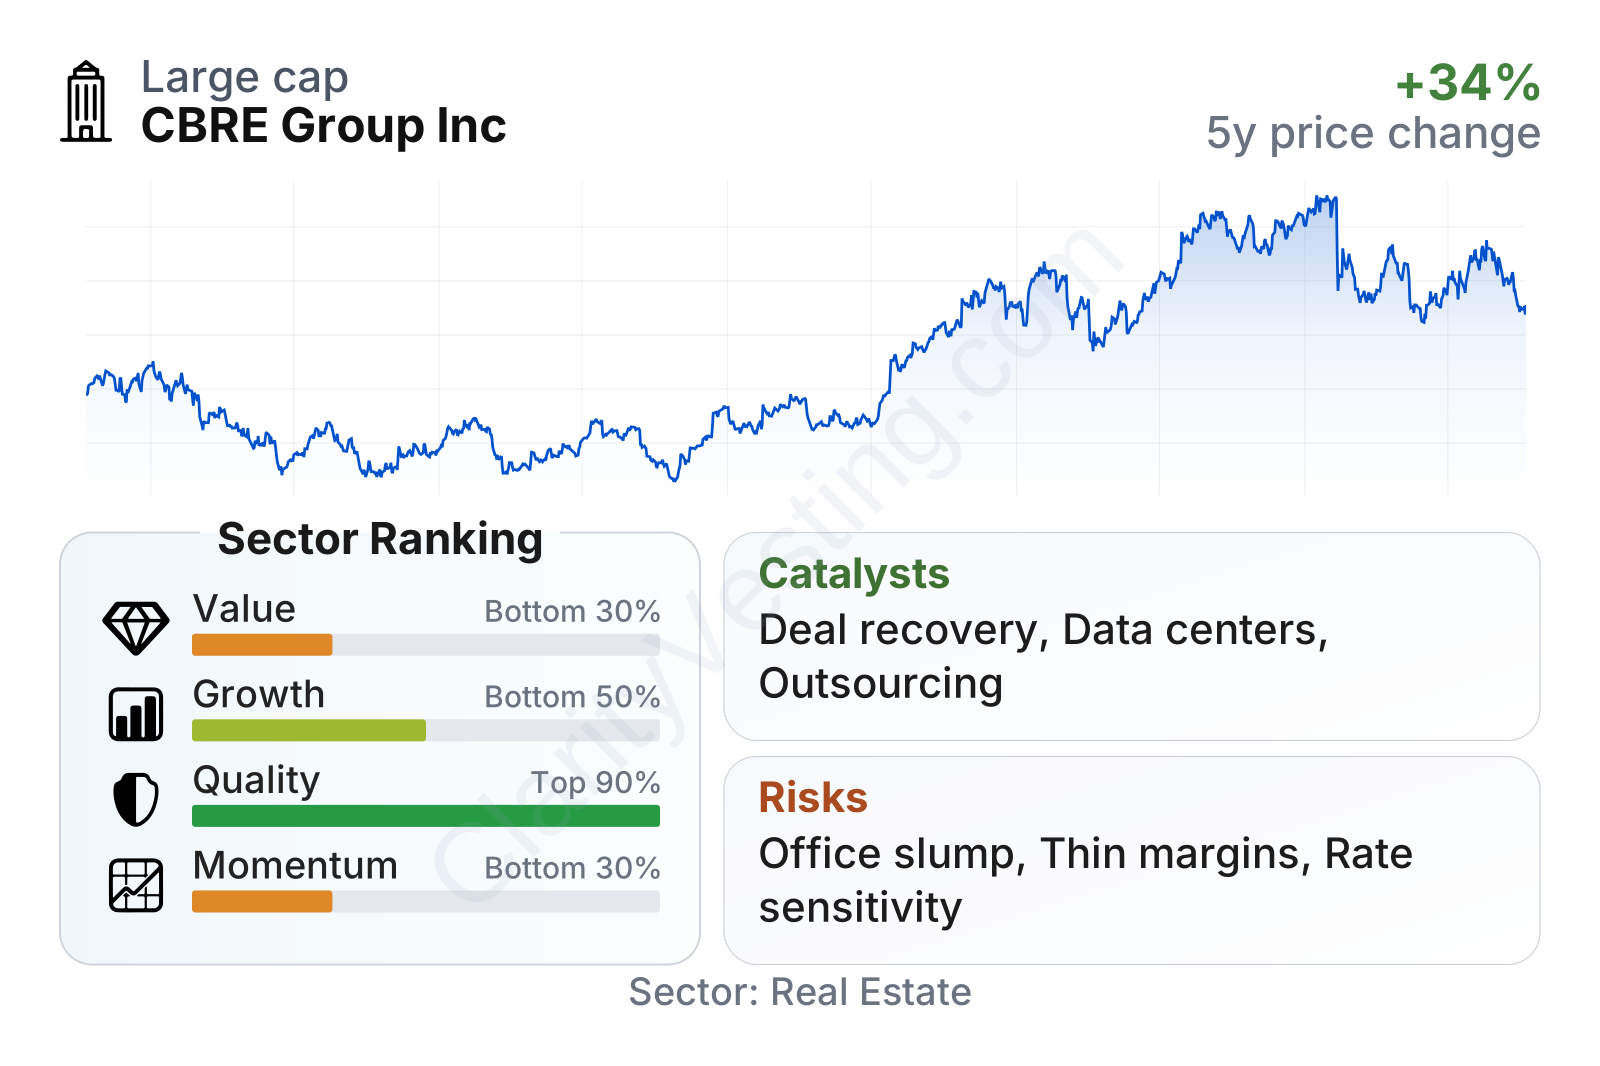
CBRE is a large-cap company with a market value in the tens of billions of dollars and a share price that has been volatile but strong over a multi-year period. The stock’s three-year performance has been much better than the sector median, even though the more recent 6- to 12-month trend has softened. On fundamentals, the picture is mixed: quality measures are clearly strong versus the sector, growth is uneven depending on the metric used, and valuation sits on the expensive side relative to many real estate peers. The balance sheet is not especially stretched for this industry, and cash generation remains positive, but the market is paying up for CBRE’s business mix and operating quality.
Growth
CBRE operates in a sector that is cyclical, but it also has several long-term growth drivers. Commercial real estate services benefit from rising outsourcing by large corporate clients, growing demand for workplace redesign, energy-efficiency upgrades, data center and logistics development, and more complex global property portfolios. Companies increasingly prefer to hire specialists to manage these needs rather than keep all capabilities in-house, and that trend supports CBRE’s scale-based model.
The company’s strategy also makes sense for future growth because it is not relying on just one real estate cycle. Transaction businesses such as leasing and investment sales can rebound sharply when capital markets improve, while recurring lines like property management, facilities management, and project management provide a steadier base. That combination gives CBRE exposure both to cyclical recovery and to structural outsourcing demand.
One important support is the company’s continued ability to grow revenue per share over time. Even though earnings and free cash flow have been less smooth, top-line expansion on a per-share basis has been strong over the last five years, comfortably ahead of the sector median.
This trend suggests the company has been adding business at scale and not simply growing through financial engineering. It also indicates that acquisitions and organic expansion have, at least so far, translated into a meaningfully larger operating platform.
CBRE does not currently stand out as an income stock. The dividend is not a central part of the equity case, and the trailing yield is effectively absent compared with many real estate names that return more cash directly to shareholders.
That is not necessarily a weakness in itself. For a services-led company like CBRE, retaining capital for acquisitions, platform investment, and selective buybacks can be more relevant than a regular dividend. It simply means the company’s long-term appeal depends far more on business expansion and profit compounding than on cash income.
A major catalyst is any normalization in commercial property transactions. If interest rates stabilize or ease and financing markets become more active, leasing, debt placement, and investment sales can all improve together. Another catalyst is the continued expansion of project management and outsourcing services, especially with demand linked to large corporate occupiers, industrial and logistics facilities, and data center infrastructure. The company has also been active in strengthening its capabilities through acquisitions, which can widen its client reach and deepen recurring service revenue.
Recent company updates have pointed to stronger momentum in parts of the advisory and project-led businesses after the weaker commercial real estate environment seen in 2023. That does not remove cyclicality, but it does suggest CBRE is positioned to benefit early if market activity broadens further.
Risks
This article is for informational purposes only and does not constitute financial advice. Some content is AI-generated. See Disclaimer