Stock Ranking
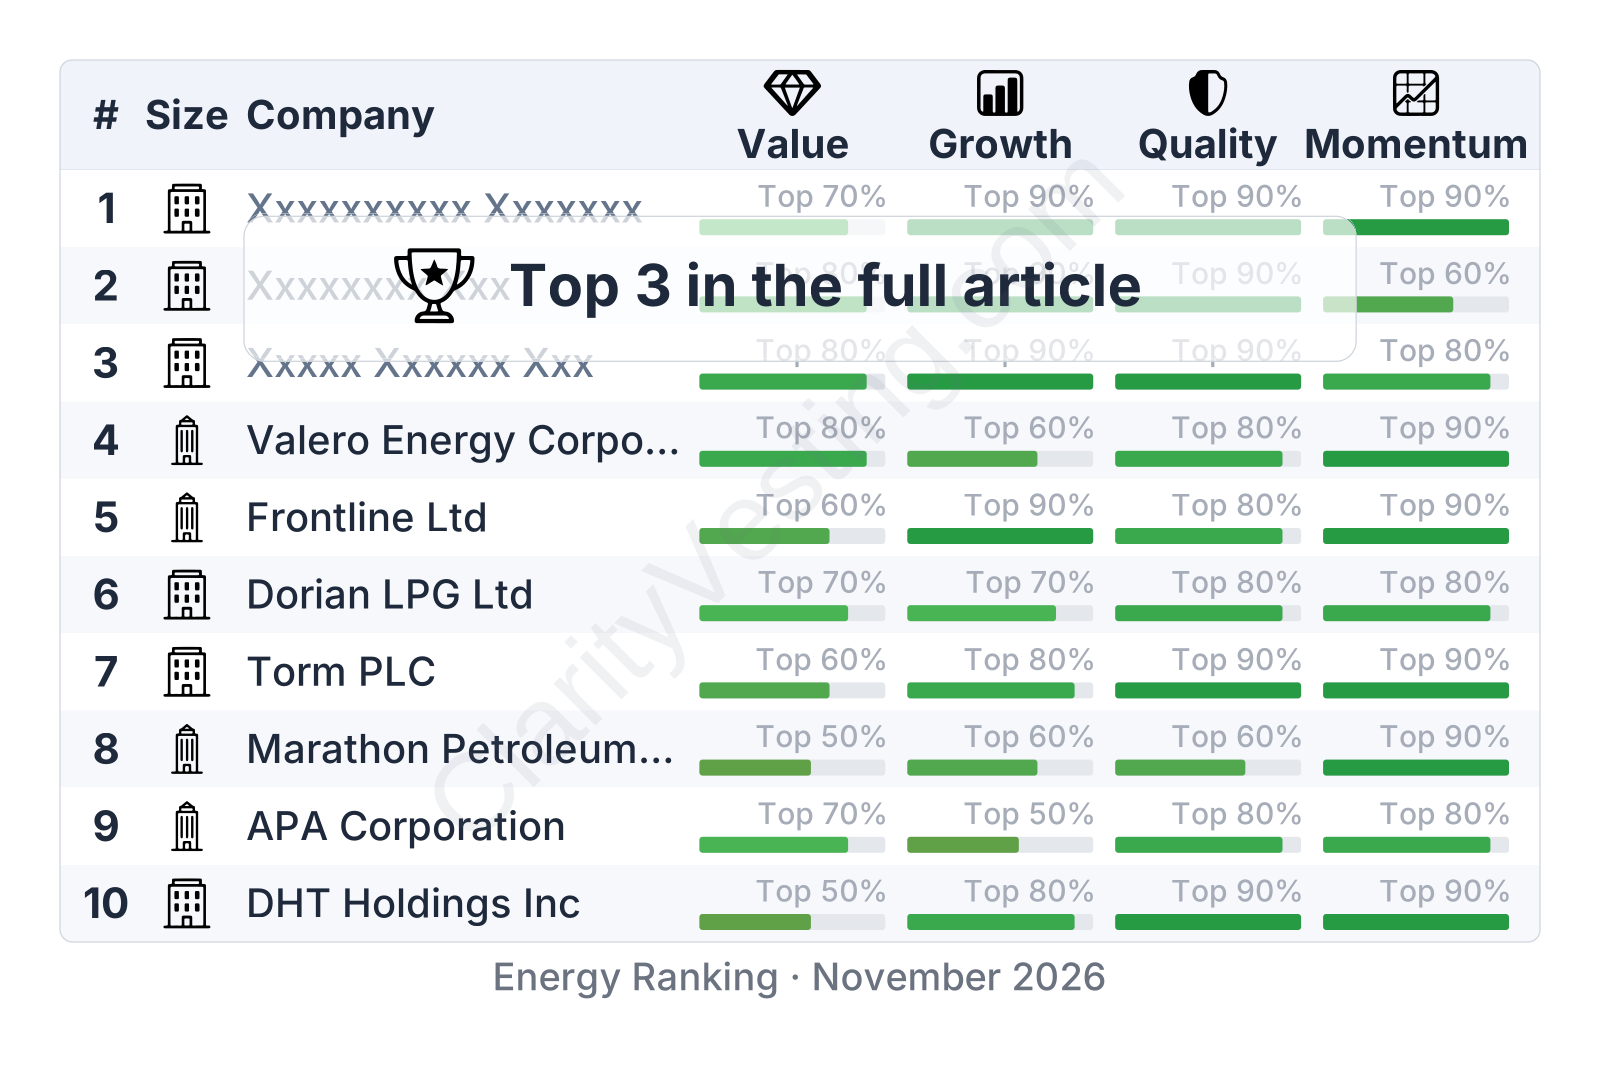
Energy Stock Ranking · November 2026
Published 01 Nov 2026
•
Updated 01 Nov 2026
This sector ranking is based on quantitative metrics grouped into four factors:
Value : measures how expensive a stock is relative to the company’s fundamentalsGrowth : measures how quickly the business is expandingQuality : assesses business durability, with a focus on debt levels, margins, and return on invested capitalMomentum : analyzes the current direction and strength of the stock price trendCompanies with strong fundamentals have historically delivered superior long-term performance. However, quantitative metrics alone are not sufficient to evaluate a business. Understanding how a company operates, along with its catalysts and risks, provides a more complete picture.
Quantitative rankings should be used as a starting point for research rather than as standalone investment decisions.
The ranking includes companies across different market capitalizations. Smaller-cap stocks may offer stronger growth opportunities but generally carry higher volatility and business risk.
CopyRight:SVG Design Editor;
configurationStart;Unit=smInches;Dpi=96;Division=4;Grid=True;Zoom=5;CanvasW=122.304;CanvasH=192;configurationEnd;
Large cap
HF Sinclair Corp
+304%
5y price change
CopyRight:SVG Design Editor;
configurationStart;Unit=smInches;Dpi=96;Division=4;Grid=True;Zoom=5;CanvasW=240;CanvasH=192;configurationEnd;
Value
Top 80%
CopyRight:SVG Design Editor;
configurationStart;Unit=smInches;Dpi=96;Division=4;Grid=True;Zoom=5;CanvasW=193.728;CanvasH=192;configurationEnd;
Growth
Bottom 50%
CopyRight:SVG Design Editor;
configurationStart;Unit=smInches;Dpi=96;Division=4;Grid=True;Zoom=5;CanvasW=160.128;CanvasH=192;configurationEnd;
Quality
Top 60%
CopyRight:SVG Design Editor;
configurationStart;Unit=smInches;Dpi=96;Division=4;Grid=True;Zoom=5;CanvasW=192.672;CanvasH=192;configurationEnd;
Momentum
Top 90%
Sector Ranking
Catalysts
Margin recovery, renewables,
lubricants
Risks
Refining margins, outages,
regulation
Sector: Energy
ClarityVesting.com
HF Sinclair is a large U.S. refiner with added exposure to marketing, logistics, lubricants, and renewable fuels. Low leverage, solid cash generation, and a recovering earnings profile make its long-term positioning worth a closer look.
Stock analysis HF Sinclair Corp
CopyRight:SVG Design Editor;
configurationStart;Unit=smInches;Dpi=96;Division=4;Grid=True;Zoom=5;CanvasW=180.864;CanvasH=192;configurationEnd;
Mid cap
Valaris Ltd
+196%
5y price change
CopyRight:SVG Design Editor;
configurationStart;Unit=smInches;Dpi=96;Division=4;Grid=True;Zoom=5;CanvasW=240;CanvasH=192;configurationEnd;
Value
Bottom 30%
CopyRight:SVG Design Editor;
configurationStart;Unit=smInches;Dpi=96;Division=4;Grid=True;Zoom=5;CanvasW=193.728;CanvasH=192;configurationEnd;
Growth
Top 80%
CopyRight:SVG Design Editor;
configurationStart;Unit=smInches;Dpi=96;Division=4;Grid=True;Zoom=5;CanvasW=160.128;CanvasH=192;configurationEnd;
Quality
Top 70%
CopyRight:SVG Design Editor;
configurationStart;Unit=smInches;Dpi=96;Division=4;Grid=True;Zoom=5;CanvasW=192.672;CanvasH=192;configurationEnd;
Momentum
Top 70%
Sector Ranking
Catalysts
Deepwater dayrates, Tight rig
supply
Risks
Oil price slump, Contract gaps,
Reactivation
Sector: Energy
ClarityVesting.com
Valaris operates offshore drilling rigs for oil and gas producers, with its strongest exposure in premium deepwater markets. Revenue, margins, and balance-sheet strength have improved sharply, making its offshore recovery profile worth a closer look.
Stock analysis Valaris Ltd
CopyRight:SVG Design Editor;
configurationStart;Unit=smInches;Dpi=96;Division=4;Grid=True;Zoom=5;CanvasW=180.864;CanvasH=192;configurationEnd;
Mid cap
BW LPG Limited
+997%
5y price change
CopyRight:SVG Design Editor;
configurationStart;Unit=smInches;Dpi=96;Division=4;Grid=True;Zoom=5;CanvasW=240;CanvasH=192;configurationEnd;
Value
Top 70%
CopyRight:SVG Design Editor;
configurationStart;Unit=smInches;Dpi=96;Division=4;Grid=True;Zoom=5;CanvasW=193.728;CanvasH=192;configurationEnd;
Growth
Bottom 50%
CopyRight:SVG Design Editor;
configurationStart;Unit=smInches;Dpi=96;Division=4;Grid=True;Zoom=5;CanvasW=160.128;CanvasH=192;configurationEnd;
Quality
Top 70%
CopyRight:SVG Design Editor;
configurationStart;Unit=smInches;Dpi=96;Division=4;Grid=True;Zoom=5;CanvasW=192.672;CanvasH=192;configurationEnd;
Momentum
Top 80%
Sector Ranking
Catalysts
U.S. LPG exports, VLGC scale,
dual-fuel fleet
Risks
Freight-rate swings, vessel
oversupply, regulation
Sector: Energy
ClarityVesting.com
BW LPG ranks among the world’s largest LPG shipping operators, transporting propane and butane on a global fleet of very large gas carriers. Its scale, strong cash generation, and efficient fleet make it a notable company to examine, especially as LPG export trade continues to expand.
Stock analysis BW LPG Limited
CopyRight:SVG Design Editor;
configurationStart;Unit=smInches;Dpi=96;Division=4;Grid=True;Zoom=5;CanvasW=122.304;CanvasH=192;configurationEnd;
Large cap
Cheniere Energy Inc
+228%
5y price change
CopyRight:SVG Design Editor;
configurationStart;Unit=smInches;Dpi=96;Division=4;Grid=True;Zoom=5;CanvasW=240;CanvasH=192;configurationEnd;
Value
Bottom 50%
CopyRight:SVG Design Editor;
configurationStart;Unit=smInches;Dpi=96;Division=4;Grid=True;Zoom=5;CanvasW=193.728;CanvasH=192;configurationEnd;
Growth
Top 80%
CopyRight:SVG Design Editor;
configurationStart;Unit=smInches;Dpi=96;Division=4;Grid=True;Zoom=5;CanvasW=160.128;CanvasH=192;configurationEnd;
Quality
Top 60%
CopyRight:SVG Design Editor;
configurationStart;Unit=smInches;Dpi=96;Division=4;Grid=True;Zoom=5;CanvasW=192.672;CanvasH=192;configurationEnd;
Momentum
Top 60%
Sector Ranking
Catalysts
Corpus Christi expansion, long-term
LNG deals
Risks
High leverage, LNG price swings,
outages
Sector: Energy
ClarityVesting.com
Cheniere Energy operates major U.S. LNG export terminals and sits at the center of a growing global gas trade. Scale, long-term contracts, and strong cash generation make it a standout infrastructure operator, with future upside closely tied to new capacity coming online.
Stock analysis Cheniere Energy Inc
CopyRight:SVG Design Editor;
configurationStart;Unit=smInches;Dpi=96;Division=4;Grid=True;Zoom=5;CanvasW=122.304;CanvasH=192;configurationEnd;
Large cap
Range Resources Corp
+142%
5y price change
CopyRight:SVG Design Editor;
configurationStart;Unit=smInches;Dpi=96;Division=4;Grid=True;Zoom=5;CanvasW=240;CanvasH=192;configurationEnd;
Value
Bottom 50%
CopyRight:SVG Design Editor;
configurationStart;Unit=smInches;Dpi=96;Division=4;Grid=True;Zoom=5;CanvasW=193.728;CanvasH=192;configurationEnd;
Growth
Top 70%
CopyRight:SVG Design Editor;
configurationStart;Unit=smInches;Dpi=96;Division=4;Grid=True;Zoom=5;CanvasW=160.128;CanvasH=192;configurationEnd;
Quality
Top 80%
CopyRight:SVG Design Editor;
configurationStart;Unit=smInches;Dpi=96;Division=4;Grid=True;Zoom=5;CanvasW=192.672;CanvasH=192;configurationEnd;
Momentum
Top 60%
Sector Ranking
Catalysts
LNG demand, FCF rebound, lower debt
Risks
Gas prices, Appalachia basis,
regulation
Sector: Energy
ClarityVesting.com
Range Resources is a focused Appalachian gas producer with stronger margins, lower debt, and rebounding free cash flow. Its concentrated asset base and improved discipline make it a useful case study for understanding long-term potential in U.S. natural gas.
Stock analysis Range Resources Corp
CopyRight:SVG Design Editor;
configurationStart;Unit=smInches;Dpi=96;Division=4;Grid=True;Zoom=5;CanvasW=180.864;CanvasH=192;configurationEnd;
Mid cap
Par Pacific Holdings Inc
+393%
5y price change
CopyRight:SVG Design Editor;
configurationStart;Unit=smInches;Dpi=96;Division=4;Grid=True;Zoom=5;CanvasW=240;CanvasH=192;configurationEnd;
Value
Top 80%
CopyRight:SVG Design Editor;
configurationStart;Unit=smInches;Dpi=96;Division=4;Grid=True;Zoom=5;CanvasW=193.728;CanvasH=192;configurationEnd;
Growth
Top 70%
CopyRight:SVG Design Editor;
configurationStart;Unit=smInches;Dpi=96;Division=4;Grid=True;Zoom=5;CanvasW=160.128;CanvasH=192;configurationEnd;
Quality
Top 80%
CopyRight:SVG Design Editor;
configurationStart;Unit=smInches;Dpi=96;Division=4;Grid=True;Zoom=5;CanvasW=192.672;CanvasH=192;configurationEnd;
Momentum
Top 70%
Sector Ranking
Catalysts
Margin recovery, Hawaii asset
optimization
Risks
Refining volatility, asset
concentration
Sector: Energy
ClarityVesting.com
Par Pacific Holdings operates a focused refining, logistics, and fuel marketing network across strategic regional markets. Recent results point to a sharp earnings recovery, strong returns on capital, and a valuation that still looks modest relative to that improved operating profile.
Stock analysis Par Pacific Holdings Inc
CopyRight:SVG Design Editor;
configurationStart;Unit=smInches;Dpi=96;Division=4;Grid=True;Zoom=5;CanvasW=180.864;CanvasH=192;configurationEnd;
Mid cap
Tidewater Inc
+636%
5y price change
CopyRight:SVG Design Editor;
configurationStart;Unit=smInches;Dpi=96;Division=4;Grid=True;Zoom=5;CanvasW=240;CanvasH=192;configurationEnd;
Value
Bottom 30%
CopyRight:SVG Design Editor;
configurationStart;Unit=smInches;Dpi=96;Division=4;Grid=True;Zoom=5;CanvasW=193.728;CanvasH=192;configurationEnd;
Growth
Top 90%
CopyRight:SVG Design Editor;
configurationStart;Unit=smInches;Dpi=96;Division=4;Grid=True;Zoom=5;CanvasW=160.128;CanvasH=192;configurationEnd;
Quality
Top 80%
CopyRight:SVG Design Editor;
configurationStart;Unit=smInches;Dpi=96;Division=4;Grid=True;Zoom=5;CanvasW=192.672;CanvasH=192;configurationEnd;
Momentum
Bottom 50%
Sector Ranking
Catalysts
Offshore day rates, Fleet scale,
Buybacks
Risks
Oil-price slump, Vessel oversupply,
Cyclicality
Sector: Energy
ClarityVesting.com
Tidewater runs one of the world’s largest offshore support vessel fleets, serving oil and gas producers across key marine basins. Profitability, cash flow, and scale have improved sharply, making it a useful lens on the offshore recovery and its staying power.
Stock analysis Tidewater Inc
CopyRight:SVG Design Editor;
configurationStart;Unit=smInches;Dpi=96;Division=4;Grid=True;Zoom=5;CanvasW=216.096;CanvasH=192;configurationEnd;
Small cap
Riley Exploration Permian Inc
+157%
5y price change
CopyRight:SVG Design Editor;
configurationStart;Unit=smInches;Dpi=96;Division=4;Grid=True;Zoom=5;CanvasW=240;CanvasH=192;configurationEnd;
Value
Bottom 50%
CopyRight:SVG Design Editor;
configurationStart;Unit=smInches;Dpi=96;Division=4;Grid=True;Zoom=5;CanvasW=193.728;CanvasH=192;configurationEnd;
Growth
Top 90%
CopyRight:SVG Design Editor;
configurationStart;Unit=smInches;Dpi=96;Division=4;Grid=True;Zoom=5;CanvasW=160.128;CanvasH=192;configurationEnd;
Quality
Top 50%
CopyRight:SVG Design Editor;
configurationStart;Unit=smInches;Dpi=96;Division=4;Grid=True;Zoom=5;CanvasW=192.672;CanvasH=192;configurationEnd;
Momentum
Top 80%
Sector Ranking
Catalysts
Yeso drilling, strong margins,
dividend
Risks
Oil prices, reserve concentration,
debt
Sector: Energy
ClarityVesting.com
Riley Exploration Permian is a focused Permian producer with strong recent revenue growth, high margins, and a valuation that remains modest against current earnings. Its niche operating footprint and disciplined development model make the company worth a closer look.
Stock analysis Riley Exploration Permian Inc
CopyRight:SVG Design Editor;
configurationStart;Unit=smInches;Dpi=96;Division=4;Grid=True;Zoom=5;CanvasW=180.864;CanvasH=192;configurationEnd;
Mid cap
Cactus Inc
+57%
5y price change
CopyRight:SVG Design Editor;
configurationStart;Unit=smInches;Dpi=96;Division=4;Grid=True;Zoom=5;CanvasW=240;CanvasH=192;configurationEnd;
Value
Bottom 30%
CopyRight:SVG Design Editor;
configurationStart;Unit=smInches;Dpi=96;Division=4;Grid=True;Zoom=5;CanvasW=193.728;CanvasH=192;configurationEnd;
Growth
Top 80%
CopyRight:SVG Design Editor;
configurationStart;Unit=smInches;Dpi=96;Division=4;Grid=True;Zoom=5;CanvasW=160.128;CanvasH=192;configurationEnd;
Quality
Top 90%
CopyRight:SVG Design Editor;
configurationStart;Unit=smInches;Dpi=96;Division=4;Grid=True;Zoom=5;CanvasW=192.672;CanvasH=192;configurationEnd;
Momentum
Top 50%
Sector Ranking
Catalysts
2026 sales rebound, flexible pipe
expansion
Risks
Oilfield cycle, margin compression,
execution
Sector: Energy
ClarityVesting.com
Cactus is a specialized oilfield equipment company with strong positions in pressure control and flexible pipe. Fast revenue recovery, high returns on capital, low debt, and healthy cash generation make its operating profile stand out within energy services.
Stock analysis Cactus Inc
CopyRight:SVG Design Editor;
configurationStart;Unit=smInches;Dpi=96;Division=4;Grid=True;Zoom=5;CanvasW=122.304;CanvasH=192;configurationEnd;
Large cap
Phillips 66
+337%
5y price change
CopyRight:SVG Design Editor;
configurationStart;Unit=smInches;Dpi=96;Division=4;Grid=True;Zoom=5;CanvasW=240;CanvasH=192;configurationEnd;
Value
Top 70%
CopyRight:SVG Design Editor;
configurationStart;Unit=smInches;Dpi=96;Division=4;Grid=True;Zoom=5;CanvasW=193.728;CanvasH=192;configurationEnd;
Growth
Top 50%
CopyRight:SVG Design Editor;
configurationStart;Unit=smInches;Dpi=96;Division=4;Grid=True;Zoom=5;CanvasW=160.128;CanvasH=192;configurationEnd;
Quality
Top 70%
CopyRight:SVG Design Editor;
configurationStart;Unit=smInches;Dpi=96;Division=4;Grid=True;Zoom=5;CanvasW=192.672;CanvasH=192;configurationEnd;
Momentum
Top 90%
Sector Ranking
Catalysts
Refining optimization, CPChem
recovery
Risks
Refining margin swings, regulation
Sector: Energy
ClarityVesting.com
Phillips 66 is a large downstream energy company built around refining, logistics, chemicals, and fuel marketing. Its scale, diversified asset base, and stronger recent earnings momentum make it an interesting case for readers exploring long-term exposure to the energy value chain.
Stock analysis Phillips 66
CopyRight:SVG Design Editor;
configurationStart;Unit=smInches;Dpi=96;Division=4;Grid=True;Zoom=5;CanvasW=180.864;CanvasH=192;configurationEnd;
Mid cap
DHT Holdings Inc
+491%
5y price change
CopyRight:SVG Design Editor;
configurationStart;Unit=smInches;Dpi=96;Division=4;Grid=True;Zoom=5;CanvasW=240;CanvasH=192;configurationEnd;
Value
Top 50%
CopyRight:SVG Design Editor;
configurationStart;Unit=smInches;Dpi=96;Division=4;Grid=True;Zoom=5;CanvasW=193.728;CanvasH=192;configurationEnd;
Growth
Top 80%
CopyRight:SVG Design Editor;
configurationStart;Unit=smInches;Dpi=96;Division=4;Grid=True;Zoom=5;CanvasW=160.128;CanvasH=192;configurationEnd;
Quality
Top 90%
CopyRight:SVG Design Editor;
configurationStart;Unit=smInches;Dpi=96;Division=4;Grid=True;Zoom=5;CanvasW=192.672;CanvasH=192;configurationEnd;
Momentum
Top 90%
Sector Ranking
Catalysts
VLCC supply discipline, Longer
trade routes
Risks
Freight-rate swings, Single-segment
exposure
Sector: Energy
ClarityVesting.com
DHT Holdings operates a concentrated fleet of very large crude carriers, giving it direct exposure to tanker market strength. High margins, low leverage, and stronger earnings make it a shipping name worth examining for long-term portfolio research.
Stock analysis DHT Holdings Inc
CopyRight:SVG Design Editor;
configurationStart;Unit=smInches;Dpi=96;Division=4;Grid=True;Zoom=5;CanvasW=122.304;CanvasH=192;configurationEnd;
Large cap
APA Corporation
+126%
5y price change
CopyRight:SVG Design Editor;
configurationStart;Unit=smInches;Dpi=96;Division=4;Grid=True;Zoom=5;CanvasW=240;CanvasH=192;configurationEnd;
Value
Top 70%
CopyRight:SVG Design Editor;
configurationStart;Unit=smInches;Dpi=96;Division=4;Grid=True;Zoom=5;CanvasW=193.728;CanvasH=192;configurationEnd;
Growth
Top 50%
CopyRight:SVG Design Editor;
configurationStart;Unit=smInches;Dpi=96;Division=4;Grid=True;Zoom=5;CanvasW=160.128;CanvasH=192;configurationEnd;
Quality
Top 80%
CopyRight:SVG Design Editor;
configurationStart;Unit=smInches;Dpi=96;Division=4;Grid=True;Zoom=5;CanvasW=192.672;CanvasH=192;configurationEnd;
Momentum
Top 80%
Sector Ranking
Catalysts
Suriname project, strong cash flow
Risks
Oil prices, Egypt risk, project
delays
Sector: Energy
ClarityVesting.com
APA Corporation is an oil and gas producer with cash-generating assets in the U.S., Egypt, and the North Sea, plus major long-term upside from Suriname. Strong margins and free cash flow make its valuation worth a closer look.
Stock analysis APA Corporation
CopyRight:SVG Design Editor;
configurationStart;Unit=smInches;Dpi=96;Division=4;Grid=True;Zoom=5;CanvasW=122.304;CanvasH=192;configurationEnd;
Large cap
Marathon Petroleum Corp
+669%
5y price change
CopyRight:SVG Design Editor;
configurationStart;Unit=smInches;Dpi=96;Division=4;Grid=True;Zoom=5;CanvasW=240;CanvasH=192;configurationEnd;
Value
Top 50%
CopyRight:SVG Design Editor;
configurationStart;Unit=smInches;Dpi=96;Division=4;Grid=True;Zoom=5;CanvasW=193.728;CanvasH=192;configurationEnd;
Growth
Top 60%
CopyRight:SVG Design Editor;
configurationStart;Unit=smInches;Dpi=96;Division=4;Grid=True;Zoom=5;CanvasW=160.128;CanvasH=192;configurationEnd;
Quality
Top 60%
CopyRight:SVG Design Editor;
configurationStart;Unit=smInches;Dpi=96;Division=4;Grid=True;Zoom=5;CanvasW=192.672;CanvasH=192;configurationEnd;
Momentum
Top 90%
Sector Ranking
Catalysts
MPLX growth, export demand,
capacity discipline
Risks
Refining margin swings, high
leverage, regulation
Sector: Energy
ClarityVesting.com
Marathon Petroleum is a giant U.S. refiner backed by a large logistics network and MPLX midstream exposure. The mix of scale, cash generation, and constrained industry capacity makes it a notable long-term energy business worth a closer look.
Stock analysis Marathon Petroleum Corp
CopyRight:SVG Design Editor;
configurationStart;Unit=smInches;Dpi=96;Division=4;Grid=True;Zoom=5;CanvasW=180.864;CanvasH=192;configurationEnd;
Mid cap
Torm PLC
+986%
5y price change
CopyRight:SVG Design Editor;
configurationStart;Unit=smInches;Dpi=96;Division=4;Grid=True;Zoom=5;CanvasW=240;CanvasH=192;configurationEnd;
Value
Top 60%
CopyRight:SVG Design Editor;
configurationStart;Unit=smInches;Dpi=96;Division=4;Grid=True;Zoom=5;CanvasW=193.728;CanvasH=192;configurationEnd;
Growth
Top 80%
CopyRight:SVG Design Editor;
configurationStart;Unit=smInches;Dpi=96;Division=4;Grid=True;Zoom=5;CanvasW=160.128;CanvasH=192;configurationEnd;
Quality
Top 90%
CopyRight:SVG Design Editor;
configurationStart;Unit=smInches;Dpi=96;Division=4;Grid=True;Zoom=5;CanvasW=192.672;CanvasH=192;configurationEnd;
Momentum
Top 90%
Sector Ranking
Catalysts
Long-haul fuel trades, Fleet
discipline
Risks
Freight-rate swings, Trade
normalization
Sector: Energy
ClarityVesting.com
TORM operates a large product-tanker fleet transporting gasoline, diesel, and jet fuel worldwide. Healthy margins, lower leverage, and solid cash generation distinguish it within shipping, while shifting refinery trade routes continue to provide a meaningful earnings backdrop.
Stock analysis Torm PLC
CopyRight:SVG Design Editor;
configurationStart;Unit=smInches;Dpi=96;Division=4;Grid=True;Zoom=5;CanvasW=180.864;CanvasH=192;configurationEnd;
Mid cap
Dorian LPG Ltd
+853%
5y price change
CopyRight:SVG Design Editor;
configurationStart;Unit=smInches;Dpi=96;Division=4;Grid=True;Zoom=5;CanvasW=240;CanvasH=192;configurationEnd;
Value
Top 70%
CopyRight:SVG Design Editor;
configurationStart;Unit=smInches;Dpi=96;Division=4;Grid=True;Zoom=5;CanvasW=193.728;CanvasH=192;configurationEnd;
Growth
Top 70%
CopyRight:SVG Design Editor;
configurationStart;Unit=smInches;Dpi=96;Division=4;Grid=True;Zoom=5;CanvasW=160.128;CanvasH=192;configurationEnd;
Quality
Top 80%
CopyRight:SVG Design Editor;
configurationStart;Unit=smInches;Dpi=96;Division=4;Grid=True;Zoom=5;CanvasW=192.672;CanvasH=192;configurationEnd;
Momentum
Top 90%
Sector Ranking
Catalysts
U.S. LPG exports, tight VLGC supply
Risks
Freight-rate swings, single-market
focus
Sector: Energy
ClarityVesting.com
Dorian LPG transports propane and butane on very large gas carriers, giving it direct exposure to expanding global LPG trade. Strong margins, solid cash generation, and lower leverage make the company a notable specialist worth a closer look.
Stock analysis Dorian LPG Ltd
CopyRight:SVG Design Editor;
configurationStart;Unit=smInches;Dpi=96;Division=4;Grid=True;Zoom=5;CanvasW=122.304;CanvasH=192;configurationEnd;
Large cap
Frontline Ltd
+909%
5y price change
CopyRight:SVG Design Editor;
configurationStart;Unit=smInches;Dpi=96;Division=4;Grid=True;Zoom=5;CanvasW=240;CanvasH=192;configurationEnd;
Value
Top 50%
CopyRight:SVG Design Editor;
configurationStart;Unit=smInches;Dpi=96;Division=4;Grid=True;Zoom=5;CanvasW=193.728;CanvasH=192;configurationEnd;
Growth
Top 90%
CopyRight:SVG Design Editor;
configurationStart;Unit=smInches;Dpi=96;Division=4;Grid=True;Zoom=5;CanvasW=160.128;CanvasH=192;configurationEnd;
Quality
Top 80%
CopyRight:SVG Design Editor;
configurationStart;Unit=smInches;Dpi=96;Division=4;Grid=True;Zoom=5;CanvasW=192.672;CanvasH=192;configurationEnd;
Momentum
Top 90%
Sector Ranking
Catalysts
Tight tanker supply, Strong day
rates
Risks
Rate volatility, Above-median
leverage
Sector: Energy
ClarityVesting.com
Frontline is a major crude-tanker operator whose recent performance was supported by strong shipping rates, high margins, and better cash generation. Its scale and fleet positioning keep it in focus for tracking the tanker cycle and the earnings power that comes with it.
Stock analysis Frontline Ltd
CopyRight:SVG Design Editor;
configurationStart;Unit=smInches;Dpi=96;Division=4;Grid=True;Zoom=5;CanvasW=122.304;CanvasH=192;configurationEnd;
Large cap
Valero Energy Corporation
+515%
5y price change
CopyRight:SVG Design Editor;
configurationStart;Unit=smInches;Dpi=96;Division=4;Grid=True;Zoom=5;CanvasW=240;CanvasH=192;configurationEnd;
Value
Top 80%
CopyRight:SVG Design Editor;
configurationStart;Unit=smInches;Dpi=96;Division=4;Grid=True;Zoom=5;CanvasW=193.728;CanvasH=192;configurationEnd;
Growth
Top 60%
CopyRight:SVG Design Editor;
configurationStart;Unit=smInches;Dpi=96;Division=4;Grid=True;Zoom=5;CanvasW=160.128;CanvasH=192;configurationEnd;
Quality
Top 80%
CopyRight:SVG Design Editor;
configurationStart;Unit=smInches;Dpi=96;Division=4;Grid=True;Zoom=5;CanvasW=192.672;CanvasH=192;configurationEnd;
Momentum
Top 90%
Sector Ranking
Catalysts
Renewable diesel, export scale
Risks
Refining margins, leverage spike
Sector: Energy
ClarityVesting.com
Valero is a leading independent refiner with massive scale, export reach, and a growing renewable diesel platform. Strong cash generation and efficient assets support its standing, while the latest analysis shows why it remains one of the sector’s most closely watched operators.
Stock analysis Valero Energy Corporation
This article is for informational purposes only and does not constitute financial advice. Some content is AI-generated. See Disclaimer