Stock Analysis · Marathon Petroleum Corp (MPC)
Overview
Marathon Petroleum is one of the largest downstream energy companies in the United States. In simple terms, it buys crude oil and turns it into fuels and other refined products that people and businesses use every day. Its refinery network supplies gasoline, diesel, jet fuel, asphalt, heavy fuel oil, propane, and feedstocks used by the petrochemical industry. The company also owns logistics assets that move and store petroleum products, and it has a major retail presence through the Speedway business sale proceeds having been redeployed into shareholder returns and operations rather than direct retail ownership.
The business is mainly driven by refining margins, meaning the difference between the cost of crude oil and the selling price of refined products. That makes Marathon Petroleum less dependent on finding oil underground and more dependent on plant utilization, product demand, and fuel market conditions. Its scale matters: the company operates a large refining system across the Gulf Coast, Mid-Continent, and West Coast, giving it broad market access and flexibility in sourcing crude and placing products.
Based on recent company reporting, Marathon Petroleum’s revenue mix is still heavily centered on refining and marketing, with midstream contributing a much smaller share of revenue but an important share of earnings and cash generation through MPLX, the publicly traded master limited partnership it controls.
- Refining & Marketing: about 85% to 90% of revenue. This includes crude oil refining and the sale of gasoline, distillates, jet fuel, asphalt, renewable fuels credits impacts, and other refined products through wholesale and branded channels.
- Midstream: about 10% to 15% of revenue. This includes gathering, processing, transportation, fractionation, terminaling, and storage, largely through MPLX and related logistics infrastructure.
While the midstream share of revenue is smaller, it tends to be steadier than refining because a larger portion is tied to volumes and fee-based contracts rather than direct fuel price swings. That balance is important when judging Marathon Petroleum as a long-term business rather than just a cyclical fuel refiner.
Over the past several years, revenue and profits have clearly moved with the refining cycle. The broad picture shows very high operating leverage: when margins are strong, earnings and cash flow can surge; when margins normalize, profits compress quickly. That pattern is typical for refiners, but Marathon’s scale and integrated logistics network help soften the swings.
The financial flow highlights a business with very large sales but relatively thin margins. Cost of revenue absorbs the overwhelming majority of sales, so small changes in refining margins can have a big effect on profit. After the 2022 peak, revenue and earnings cooled, but operating income and net income remained positive, showing the company still generated meaningful cash even in a less favorable part of the cycle.
Key Figures
| Metric | Value | Sector ⓘ |
|---|---|---|
| Date | Oct 24, 2026 | |
| Context | ||
| Sector | Energy | |
| Industry | Oil & Gas Refining & Marketing | |
| Market Cap ⓘ | $133.40B | |
| Beta ⓘ | 0.54 | |
Value (Cheapness) | ||
| P/E Ratio ⓘ | 16.45 | 15.40 |
| P/B Ratio ⓘ | 10.95 | 1.71 |
| FCF Yield ⓘ | 9.67% | 8.24% |
| Dividend Yield ⓘ | 0.84% | 3.52% |
| EBIT / EV ⓘ | 10.42% | 7.45% |
| PEG ⓘ | 0.90 | |
Growth (Business expansion) | ||
| Revenue Growth ⓘ | 53.70% | 26.85% |
| RPS Growth (5Y CAGR) ⓘ | 23.33% | 6.78% |
| EPS Growth (5Y CAGR) ⓘ | -8.03% | -14.41% |
| BVPS Growth (5Y CAGR) ⓘ | 2.73% | 6.08% |
| Margin Growth (5Y Trend) ⓘ | 2.95% | 0.55% |
| FCF Growth (5Y CAGR) ⓘ | 13.27% | 2.75% |
| DPS Growth (5Y CAGR) ⓘ | 12.59% | 16.79% |
Quality (Business durability) | ||
| ROIC (Latest) ⓘ | 22.66% | 11.30% |
| ROA (Latest) ⓘ | 9.64% | 6.00% |
| ROIC (5Y Median) ⓘ | 14.80% | 10.35% |
| ROA (5Y Median) ⓘ | 11.01% | 5.46% |
| Net Debt / EBIT (Latest) ⓘ | 1.88 | 1.64 |
| Net Debt / EBIT (5Y Median) ⓘ | 3.52 | 1.82 |
| Net Debt / EBITDA (Latest) ⓘ | 1.52 | 1.08 |
| Net Debt / Assets ⓘ | 28.12% | 17.29% |
| EBITDA / Interest ⓘ | 11.26 | 9.53 |
| Operating Margin (Latest) ⓘ | 9.18% | 16.21% |
| Operating Margin (5Y Median) ⓘ | 6.35% | 20.55% |
| Debt to Equity (Latest) ⓘ | 179.76% | 52.27% |
| Profit Margin (Latest) ⓘ | 5.55% | 8.79% |
| Free Cash Flow (Latest) ⓘ | $12.90B | |
Momentum (Price trend) | ||
| 3Y Return ⓘ | +229.12% | +68.93% |
| 12M Return (excl. last month) ⓘ | +120.59% | +42.90% |
| 6M Return ⓘ | +113.77% | +9.18% |
| Price vs. 200-Day MA ⓘ | +67.20% | +9.87% |
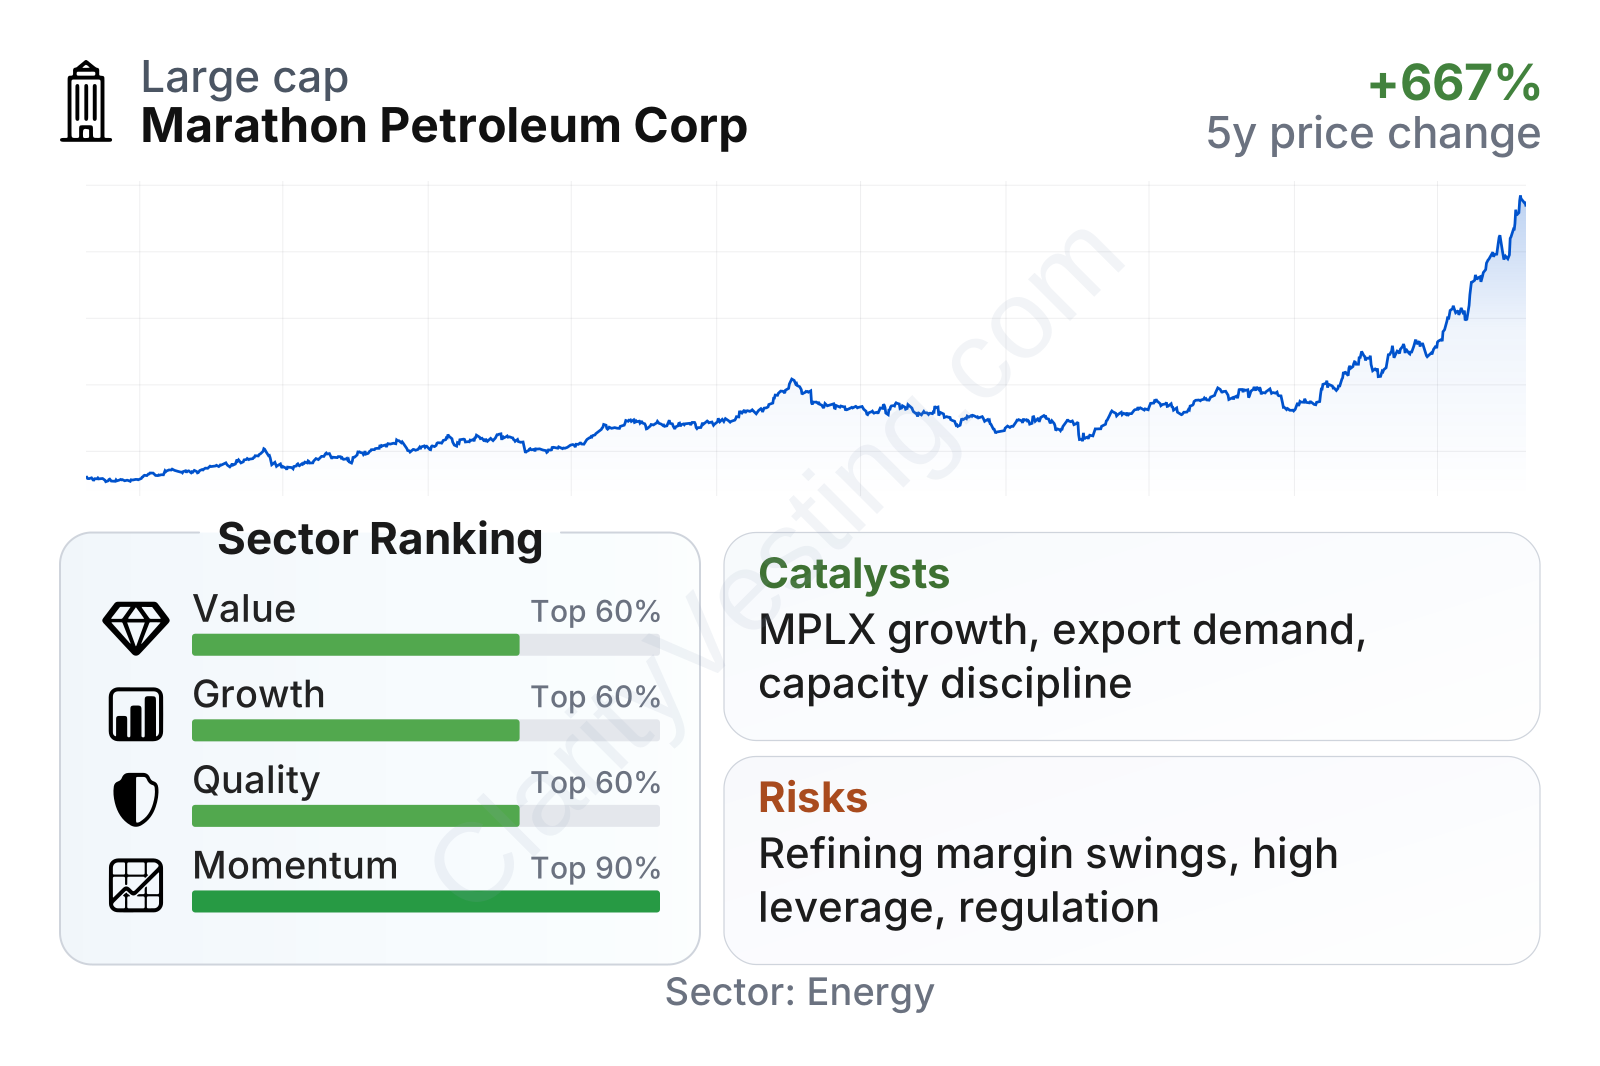
Marathon Petroleum is a very large energy company with a stock that has materially outperformed most of its sector over the last one, three, and six-year periods. On valuation, the shares do not look stretched on earnings or enterprise-value-based measures, and free cash flow yield stands above the sector median. Quality is more mixed: returns on capital are strong, but leverage is notably higher than typical energy peers and margins remain below sector medians. Growth metrics are also mixed in a useful way for long-term readers: recent revenue growth has rebounded strongly, while multi-year free cash flow and book value trends remain favorable despite the cyclical nature of refining.
Growth
Marathon Petroleum operates in a sector that is not usually described as a high-growth industry in the way software or semiconductors might be. Fuel demand in developed markets tends to grow slowly, and long-term electrification creates pressure on gasoline demand over time. However, that does not mean the company lacks growth paths. In refining, growth often comes from better utilization, improved product mix, access to advantaged crude, and capacity to return cash through the cycle. In midstream, growth can come from new pipelines, processing, export, and storage projects with steadier fee-based income.
A central part of Marathon Petroleum’s long-term logic is the combination of a large refining platform with MPLX. Refining brings upside when crack spreads are strong, while MPLX adds a more stable earnings base. This pairing makes strategic sense because it gives the company exposure to both cyclical and infrastructure-style cash flows.
Recent revenue growth has turned up sharply after a long period of contraction, suggesting the business is recovering from a softer comparison base. That rebound is encouraging, but it should be read carefully: for a refiner, revenue growth alone does not automatically mean structurally stronger economics, because changes in fuel prices also influence sales.
Free cash flow has remained substantial, even though it has come down from earlier highs. For a capital-intensive business, continued multibillion-dollar free cash flow is important because it supports debt service, capital spending, dividends, and buybacks without relying entirely on external financing. Marathon Petroleum has also emphasized disciplined capital allocation in company communications, including maintaining refinery reliability, supporting MPLX growth, and returning excess cash when market conditions allow.
One of the stronger medium-term catalysts is U.S. refining capacity discipline. New large refinery construction in the United States is rare, while demand for transportation fuels, petrochemical feedstocks, and exports remains significant. That can support industry profitability when supply stays constrained. Another catalyst is export demand, especially from the Gulf Coast, where U.S. refiners can ship products into international markets when economics are attractive.
Recent company updates have also pointed to continued project development and optimization at MPLX, including natural gas and natural gas liquids infrastructure. This matters because midstream expansion can add recurring cash flow that is less exposed to day-to-day commodity price volatility than refining.
Risks
This article is for informational purposes only and does not constitute financial advice. Some content is AI-generated. See Disclaimer


