Stock Analysis · HF Sinclair Corp (DINO)
Overview
HF Sinclair Corp is a downstream energy company focused mainly on turning crude oil into fuels and other petroleum products, then moving and selling those products through wholesale channels, commercial customers, and retail sites. Its operations are concentrated in refining and marketing, with additional exposure to renewable diesel, lubricants, specialty products, pipelines, terminals, and fuel distribution. The company operates refineries in the Mid-Continent, Southwest, Rockies, and Pacific Northwest, giving it a footprint in several important U.S. fuel markets.
For long-term analysis, the main point is that HF Sinclair is not an oil producer whose economics depend on finding new reserves. It is primarily a refiner and marketer, so its profits depend more on refining margins, plant utilization, operating discipline, logistics, and product demand for gasoline, diesel, jet fuel, asphalt, lubricants, and specialty products.
Based on the company’s recent reporting structure, its revenue sources can be summarized approximately as follows:
- Refining: about 85% to 90% of revenue. This includes sales of gasoline, diesel, jet fuel, specialty lubricant products, asphalt, and other refined petroleum products produced at its refineries.
- Marketing: about 8% to 12% of revenue. This covers branded fuel sales, wholesale supply, dealer and distributor channels, and sales tied to retail and commercial fuel distribution.
- Midstream: about 1% to 3% of revenue. This includes pipelines, terminals, tankage, and transportation services that support refinery and product movements.
- Renewables and other activities: generally a small share of revenue, but strategically important. This includes renewable diesel and related compliance value, even though its impact on earnings can be more meaningful than its share of reported revenue.
The overall business mix remains heavily tied to conventional refining, which explains why company results can swing sharply from year to year. The multiyear income flow also shows that revenue stayed large even during weaker periods, but profitability compressed meaningfully after the unusually strong refining environment of 2022. More recently, earnings recovery has depended less on sales growth alone and more on restoring margins and operating efficiency.
Key Figures
| Metric | Value | Sector ⓘ |
|---|---|---|
| Date | Oct 24, 2026 | |
| Context | ||
| Sector | Energy | |
| Industry | Oil & Gas Refining & Marketing | |
| Market Cap ⓘ | $22.28B | |
| Beta ⓘ | 0.71 | |
Value (Cheapness) | ||
| P/E Ratio ⓘ | 11.93 | 15.40 |
| P/B Ratio ⓘ | 2.19 | 1.71 |
| FCF Yield ⓘ | 11.46% | 8.24% |
| Dividend Yield ⓘ | 1.61% | 3.52% |
| EBIT / EV ⓘ | 13.45% | 7.45% |
| PEG ⓘ | 1.13 | |
Growth (Business expansion) | ||
| Revenue Growth ⓘ | 53.20% | 26.85% |
| RPS Growth (5Y CAGR) ⓘ | 6.24% | 6.78% |
| EPS Growth (5Y CAGR) ⓘ | -20.43% | -14.41% |
| BVPS Growth (5Y CAGR) ⓘ | 11.84% | 6.08% |
| Margin Growth (5Y Trend) ⓘ | -1.43% | 0.55% |
| FCF Growth (5Y CAGR) ⓘ | N/A | 2.75% |
| DPS Growth (5Y CAGR) ⓘ | 54.41% | 16.79% |
Quality (Business durability) | ||
| ROIC (Latest) ⓘ | N/A | 11.30% |
| ROA (Latest) ⓘ | 10.56% | 6.00% |
| ROIC (5Y Median) ⓘ | 9.01% | 10.35% |
| ROA (5Y Median) ⓘ | 4.57% | 5.46% |
| Net Debt / EBIT (Latest) ⓘ | 0.22 | 1.64 |
| Net Debt / EBIT (5Y Median) ⓘ | 2.38 | 1.82 |
| Net Debt / EBITDA (Latest) ⓘ | 0.17 | 1.08 |
| Net Debt / Assets ⓘ | 3.15% | 17.29% |
| EBITDA / Interest ⓘ | 19.18 | 9.53 |
| Operating Margin (Latest) ⓘ | 8.68% | 16.21% |
| Operating Margin (5Y Median) ⓘ | 4.96% | 20.55% |
| Debt to Equity (Latest) ⓘ | 27.82% | 52.27% |
| Profit Margin (Latest) ⓘ | 6.13% | 8.79% |
| Free Cash Flow (Latest) ⓘ | $2.55B | |
Momentum (Price trend) | ||
| 3Y Return ⓘ | +152.29% | +68.93% |
| 12M Return (excl. last month) ⓘ | +114.88% | +42.90% |
| 6M Return ⓘ | +113.61% | +9.18% |
| Price vs. 200-Day MA ⓘ | +66.39% | +9.87% |
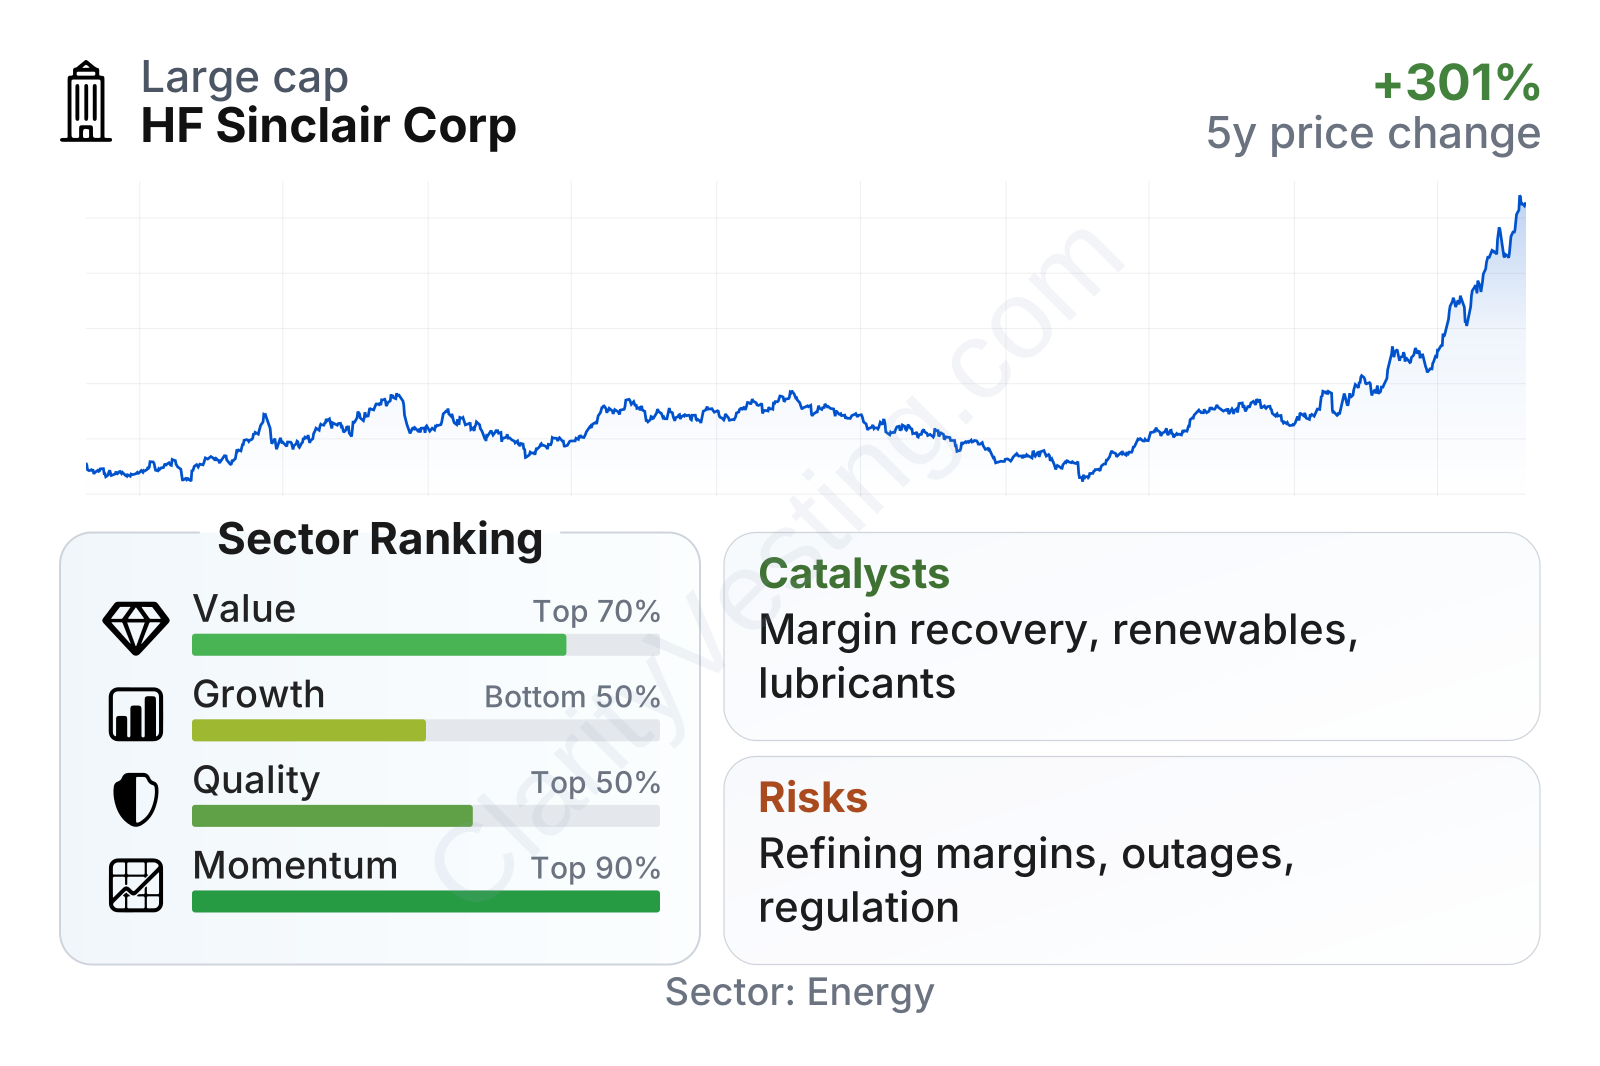
HF Sinclair is a large independent refiner by market value, but still smaller than the biggest integrated energy companies and the largest pure refining peers. The stock has shown strong momentum over the last year and over the last three years, clearly outperforming much of the energy sector on price performance. On valuation, the shares screen relatively inexpensive on earnings and cash flow measures, with free cash flow yield and EBIT relative to enterprise value standing above sector medians. Financial quality is mixed but respectable: leverage is low, interest coverage is strong, and asset returns are solid, while margins remain below sector averages. Growth indicators are less impressive over a full cycle because earnings and margins have been volatile.
Growth
HF Sinclair operates in a mature sector rather than a classic high-growth industry. Oil refining in the United States does not usually expand through rapid demand growth. Instead, growth tends to come from smart asset positioning, better product mix, acquisitions, logistics advantages, cost control, and disciplined capital allocation. That makes this a cyclical business with selective expansion opportunities rather than a structural compounder driven by booming end-market demand.
The company’s strategy still has logic for future expansion. One part is optimization of its existing refining network, where small operating improvements can have an outsized effect on profits when margins improve. Another is higher-value products such as lubricants and specialty offerings, which can be less commoditized than standard transportation fuels. A third is renewable fuels, where compliance rules and lower-carbon fuel demand can create incremental earnings opportunities if execution is strong.
Recent revenue growth has turned positive again after a weak stretch, with the latest year-over-year trend rebounding sharply. That matters, but for HF Sinclair the more important question is whether better sales are accompanied by healthier refining spreads and steadier margins. In this industry, revenue can rise simply because commodity prices move, while profits remain under pressure. So the revenue recovery is encouraging, but not enough on its own.
Cash generation gives a better read on operating strength. Free cash flow moved from negative levels in early 2022 to very strong generation in 2023, then weakened materially before improving again. That pattern fits a cyclical refiner: cash flow can be excellent when margins are favorable, but it is not consistently smooth. Even so, the current level remains meaningful and supports balance-sheet flexibility, capital spending, and shareholder distributions.
Recent company updates have also highlighted ongoing portfolio actions, refinery optimization work, and efforts to improve utilization and capture value from logistics and specialty channels. In practical terms, the strongest catalyst is not explosive volume growth; it is the possibility that a better margin environment, combined with low leverage and stronger operations, can translate into a sharper rebound in earnings than revenue trends alone would suggest.
Risks
This article is for informational purposes only and does not constitute financial advice. Some content is AI-generated. See Disclaimer


