Stock Analysis · Tidewater Inc (TDW)
Overview
Tidewater Inc. is an offshore marine services company. In simple terms, it owns and operates vessels that help offshore oil and gas producers move people, equipment, and supplies to drilling rigs and production platforms. The fleet also supports towing, anchor handling, safety, inspection, maintenance, and other specialized offshore tasks. The company operates globally, with activity spread across regions such as the Middle East, Africa, Asia-Pacific, the North Sea, and the Americas.
Its business is mainly tied to offshore energy spending. When offshore drilling and production activity rises, vessel demand and day rates usually improve. When activity slows, vessel utilization and pricing can weaken. That makes Tidewater a fairly direct way to track the health of the offshore services cycle.
Based on company filings, Tidewater’s revenue is primarily generated from vessel chartering and related marine support services. The company reports largely by geography rather than by detailed service line, so exact product-level splits are limited. A practical way to understand the business is through its regional exposure, which also reflects where offshore spending is strongest.
- Middle East and North Africa: approximately the largest revenue contributor, benefiting from steady offshore production support and national oil company activity.
- Sub-Saharan Africa: another major contributor, supported by deepwater developments and vessel demand in several producing countries.
- Asia-Pacific: meaningful contribution from offshore support work across Southeast Asia and Australia-linked markets.
- North Sea: smaller by volume but often strategically important because it includes higher-specification vessel demand.
- Americas: comparatively smaller share, including support work in selected offshore basins.
The broad financial progression over the last several years is notable: revenue rose from about $371 million in 2021 to roughly $1.35 billion in 2025, while profitability moved from losses to strong positive earnings. That reflects both a better offshore market and the company’s larger operating base after acquisitions.
The business mix has become far healthier than it was a few years ago. Revenue expanded sharply, gross profit turned strongly positive, and net income improved from deep losses to substantial profits. One point worth keeping in mind is that 2025 net income was helped by a tax-related benefit, so underlying operating performance matters more than the bottom-line jump alone.
Key Figures
| Metric | Value | Sector ⓘ |
|---|---|---|
| Date | Oct 17, 2026 | |
| Context | ||
| Sector | Energy | |
| Industry | Oil & Gas Equipment & Services | |
| Market Cap ⓘ | $4.33B | |
| Beta ⓘ | 0.60 | |
Value (Cheapness) | ||
| P/E Ratio ⓘ | 17.71 | 15.44 |
| P/B Ratio ⓘ | 2.94 | 1.73 |
| FCF Yield ⓘ | 5.96% | 8.20% |
| Dividend Yield ⓘ | N/A | 3.59% |
| EBIT / EV ⓘ | 5.27% | 7.46% |
| PEG ⓘ | -0.04 | |
Growth (Business expansion) | ||
| Revenue Growth ⓘ | 0.30% | 26.90% |
| RPS Growth (5Y CAGR) ⓘ | 31.47% | 6.90% |
| EPS Growth (5Y CAGR) ⓘ | 118.33% | -15.73% |
| BVPS Growth (5Y CAGR) ⓘ | 12.47% | 6.07% |
| Margin Growth (5Y Trend) ⓘ | 50.33% | 0.58% |
| FCF Growth (5Y CAGR) ⓘ | 176.39% | 1.86% |
| DPS Growth (5Y CAGR) ⓘ | 22.90% | 16.79% |
Quality (Business durability) | ||
| ROIC (Latest) ⓘ | 16.43% | 11.40% |
| ROA (Latest) ⓘ | 10.98% | 6.06% |
| ROIC (5Y Median) ⓘ | 9.18% | 10.30% |
| ROA (5Y Median) ⓘ | 5.78% | 5.42% |
| Net Debt / EBIT (Latest) ⓘ | 0.17 | 1.64 |
| Net Debt / EBIT (5Y Median) ⓘ | 0.69 | 1.83 |
| Net Debt / EBITDA (Latest) ⓘ | 0.09 | 1.08 |
| Net Debt / Assets ⓘ | 1.68% | 17.29% |
| EBITDA / Interest ⓘ | 6.54 | 9.64 |
| Operating Margin (Latest) ⓘ | 16.87% | 16.27% |
| Operating Margin (5Y Median) ⓘ | 18.55% | 20.39% |
| Debt to Equity (Latest) ⓘ | 46.89% | 54.76% |
| Profit Margin (Latest) ⓘ | 18.34% | 8.82% |
| Free Cash Flow (Latest) ⓘ | $258.04M | |
Momentum (Price trend) | ||
| 3Y Return ⓘ | +19.23% | +67.38% |
| 12M Return (excl. last month) ⓘ | +49.60% | +49.19% |
| 6M Return ⓘ | -1.78% | +7.07% |
| Price vs. 200-Day MA ⓘ | +6.55% | +9.56% |
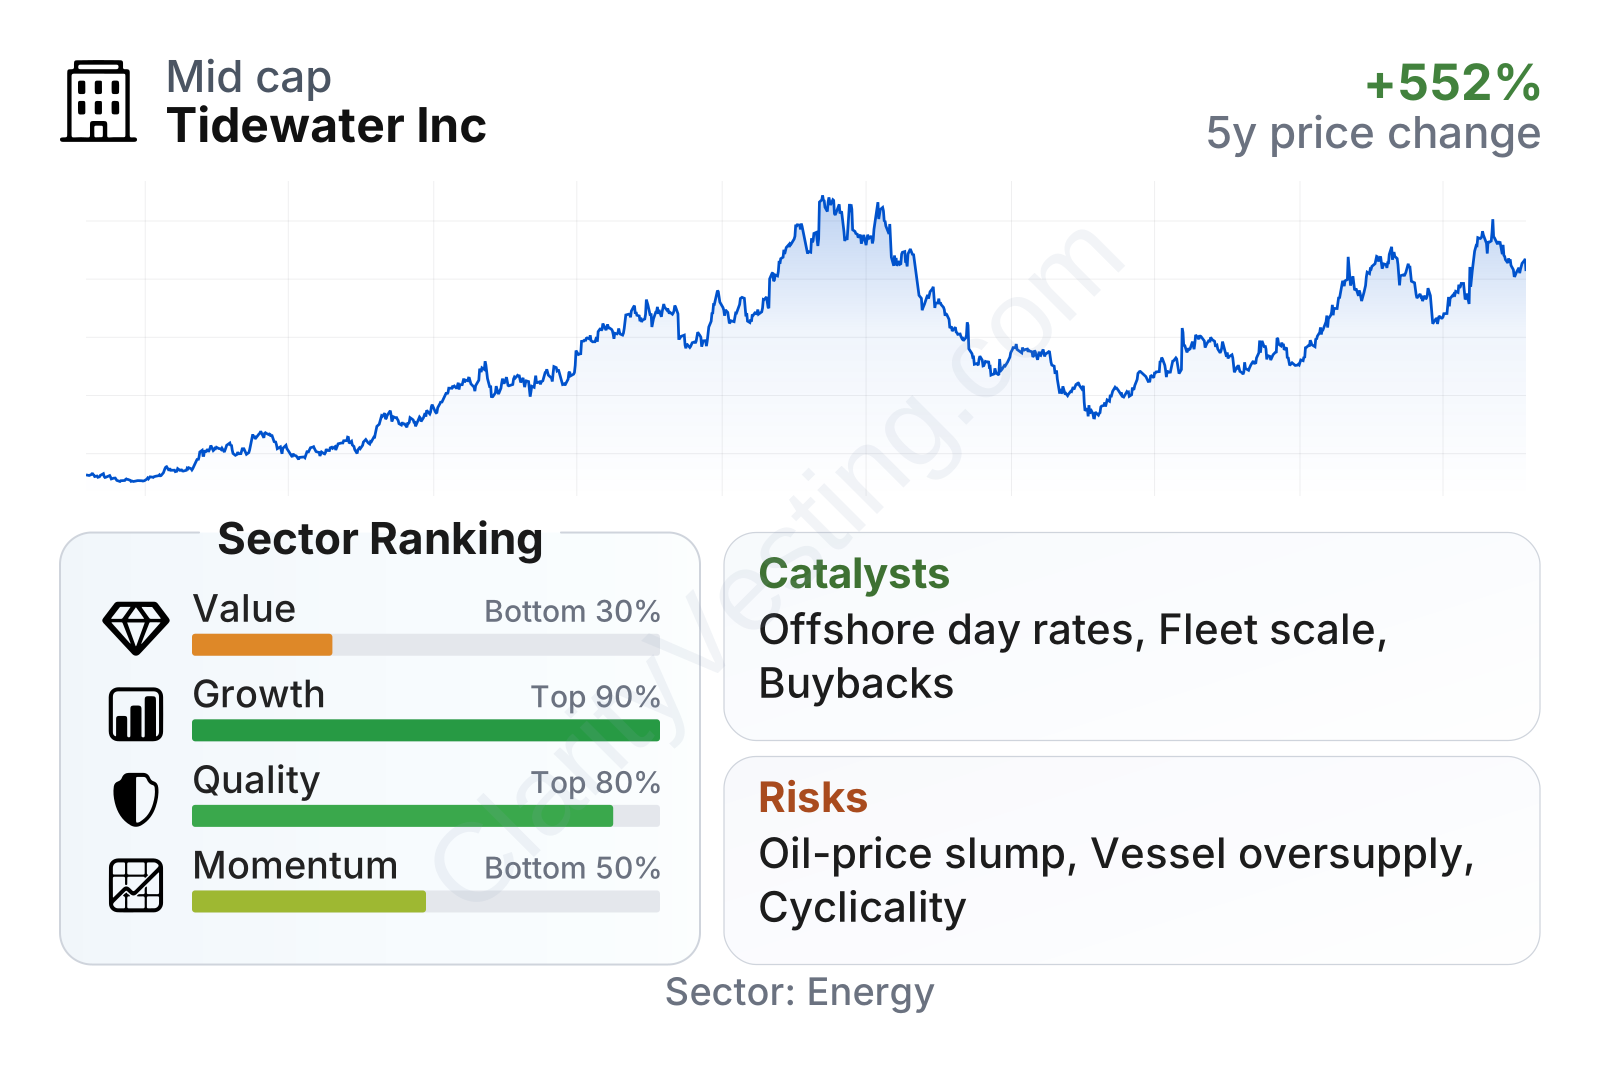
Tidewater is now a mid-sized energy services company with a market value around $4 billion. On growth and quality, it ranks well versus much of its sector: five-year revenue per share growth, earnings growth, returns on capital, and profit margin are all strong. Balance sheet measures also look healthier than many peers, with low net debt relative to earnings and debt-to-equity below the sector median.
The weaker area is valuation. Multiples such as price-to-book and free-cash-flow yield suggest the market is no longer pricing Tidewater like a distressed cyclical operator. Recent share-price momentum has also been mixed: the longer-term recovery has been substantial, but the stock has experienced large swings, which is common for companies exposed to energy cycles.
Growth
Tidewater operates in a part of the energy market that has been recovering for several years. Offshore oil and gas had a long downturn after the previous cycle peaked, which led to vessel oversupply, weak day rates, and poor profitability across the industry. That backdrop has improved as offshore projects became more competitive again, older vessels left the market, and producers focused on long-life assets that can deliver output for many years.
The company’s strategy broadly fits that recovery. Tidewater has been building scale, expanding geographic reach, and increasing exposure to higher-demand markets. Its combination with Solstad Offshore’s offshore support vessel business in 2023 was especially important because it added vessels, customers, and market presence. In a fragmented industry, greater scale can matter: it helps with fleet availability, customer coverage, cost control, and negotiating power.
Growth has clearly normalized after a surge. Year-over-year revenue increases were extremely strong through 2022, 2023, and much of 2024, then slowed sharply through 2025 and into 2026. That does not automatically signal business deterioration; it often happens after a large acquisition and a strong cyclical rebound. It does, however, suggest that future progress may depend more on utilization, pricing, and disciplined capital allocation than on easy catch-up growth.
Cash generation has been one of the more encouraging developments. Free cash flow moved from negative levels in 2022 to well over $250 million on a trailing basis by 2025-2026. For a vessel operator, this matters because a stronger cash profile can support debt reduction, fleet upgrades, selective acquisitions, and shareholder returns without putting too much strain on the balance sheet.
A meaningful catalyst is the continued tightening in parts of the offshore vessel market. If global offshore spending remains solid and vessel supply stays disciplined, day rates can remain firm or rise further. Tidewater is also positioned to benefit from contract renewals at better pricing and from demand linked to large offshore developments, particularly in the Middle East, West Africa, and other active basins. In addition, the company has recently highlighted ongoing share repurchases and capital returns, which can amplify per-share results when cash flow stays strong.
Risks
This article is for informational purposes only and does not constitute financial advice. Some content is AI-generated. See Disclaimer


