Stock Analysis · Cheniere Energy Inc (LNG)
Overview
Cheniere Energy is a U.S. liquefied natural gas, or LNG, company. Its role is to buy natural gas, cool it into liquid form at export terminals, ship it to customers around the world, and earn fees and margins from that process. The company is best known for its Sabine Pass terminal in Louisiana and its Corpus Christi terminal in Texas, which together make Cheniere one of the largest LNG exporters in the United States. In simple terms, Cheniere sits between gas producers and global buyers such as utilities, energy traders, and industrial customers.
The business is built around long-term contracts, which matter because they can make cash flows steadier than the swings in commodity prices might suggest. A large part of Cheniere’s LNG volumes is sold under agreements that include fixed fees for liquefaction capacity, while another part is exposed to market prices through LNG cargo sales and trading activity.
Based on the company’s recent reporting structure, the main sources of revenue are approximately:
- LNG sales: about 80% to 90% of revenue in recent years. This includes physical LNG cargoes sold to customers under long-term contracts and spot or short-term transactions.
- Natural gas and related sales: about 10% to 20%. This reflects gas purchased and resold, optimization activity, and other related energy marketing transactions tied to supplying LNG operations.
- Regasification and other services: typically a small share of revenue. This includes terminal-related services and other miscellaneous activities.
One important point for long-term readers is that accounting revenue can move sharply with gas prices even when the underlying contract base remains solid. That means revenue is not always the best single measure of business strength for Cheniere; contract coverage, margins, and cash generation usually tell a fuller picture.
The business has shown how volatile reported revenue can be from year to year, but it also shows a more durable pattern underneath: operating income and net income improved dramatically after 2021, interest expense has trended lower, and selling and administrative costs remain small relative to total revenue. That combination suggests scale has been helping profitability even as commodity prices moved around.
Key Figures
| Metric | Value | Sector ⓘ |
|---|---|---|
| Date | Oct 17, 2026 | |
| Context | ||
| Sector | Energy | |
| Industry | Oil & Gas Midstream | |
| Market Cap ⓘ | $59.26B | |
| Beta ⓘ | 0.06 | |
Value (Cheapness) | ||
| P/E Ratio ⓘ | 21.72 | 15.44 |
| P/B Ratio ⓘ | 65.69 | 1.73 |
| FCF Yield ⓘ | 11.88% | 8.20% |
| Dividend Yield ⓘ | 0.79% | 3.59% |
| EBIT / EV ⓘ | 7.87% | 7.46% |
| PEG ⓘ | 10.76 | |
Growth (Business expansion) | ||
| Revenue Growth ⓘ | 22.70% | 26.90% |
| RPS Growth (5Y CAGR) ⓘ | 6.37% | 6.90% |
| EPS Growth (5Y CAGR) ⓘ | -25.26% | -15.73% |
| BVPS Growth (5Y CAGR) ⓘ | N/A | 6.07% |
| Margin Growth (5Y Trend) ⓘ | 51.78% | 0.58% |
| FCF Growth (5Y CAGR) ⓘ | 13.12% | 1.86% |
| DPS Growth (5Y CAGR) ⓘ | 57.18% | 16.79% |
Quality (Business durability) | ||
| ROIC (Latest) ⓘ | 19.69% | 11.40% |
| ROA (Latest) ⓘ | 6.27% | 6.06% |
| ROIC (5Y Median) ⓘ | 18.65% | 10.30% |
| ROA (5Y Median) ⓘ | 7.48% | 5.42% |
| Net Debt / EBIT (Latest) ⓘ | 3.88 | 1.64 |
| Net Debt / EBIT (5Y Median) ⓘ | 3.28 | 1.83 |
| Net Debt / EBITDA (Latest) ⓘ | 3.06 | 1.08 |
| Net Debt / Assets ⓘ | 52.19% | 17.29% |
| EBITDA / Interest ⓘ | 8.00 | 9.64 |
| Operating Margin (Latest) ⓘ | 28.99% | 16.27% |
| Operating Margin (5Y Median) ⓘ | 40.02% | 20.39% |
| Debt to Equity (Latest) ⓘ | 428.95% | 54.76% |
| Profit Margin (Latest) ⓘ | 13.94% | 8.82% |
| Free Cash Flow (Latest) ⓘ | $7.04B | |
Momentum (Price trend) | ||
| 3Y Return ⓘ | +62.98% | +67.38% |
| 12M Return (excl. last month) ⓘ | +17.32% | +49.19% |
| 6M Return ⓘ | +8.19% | +7.07% |
| Price vs. 200-Day MA ⓘ | +12.01% | +9.56% |
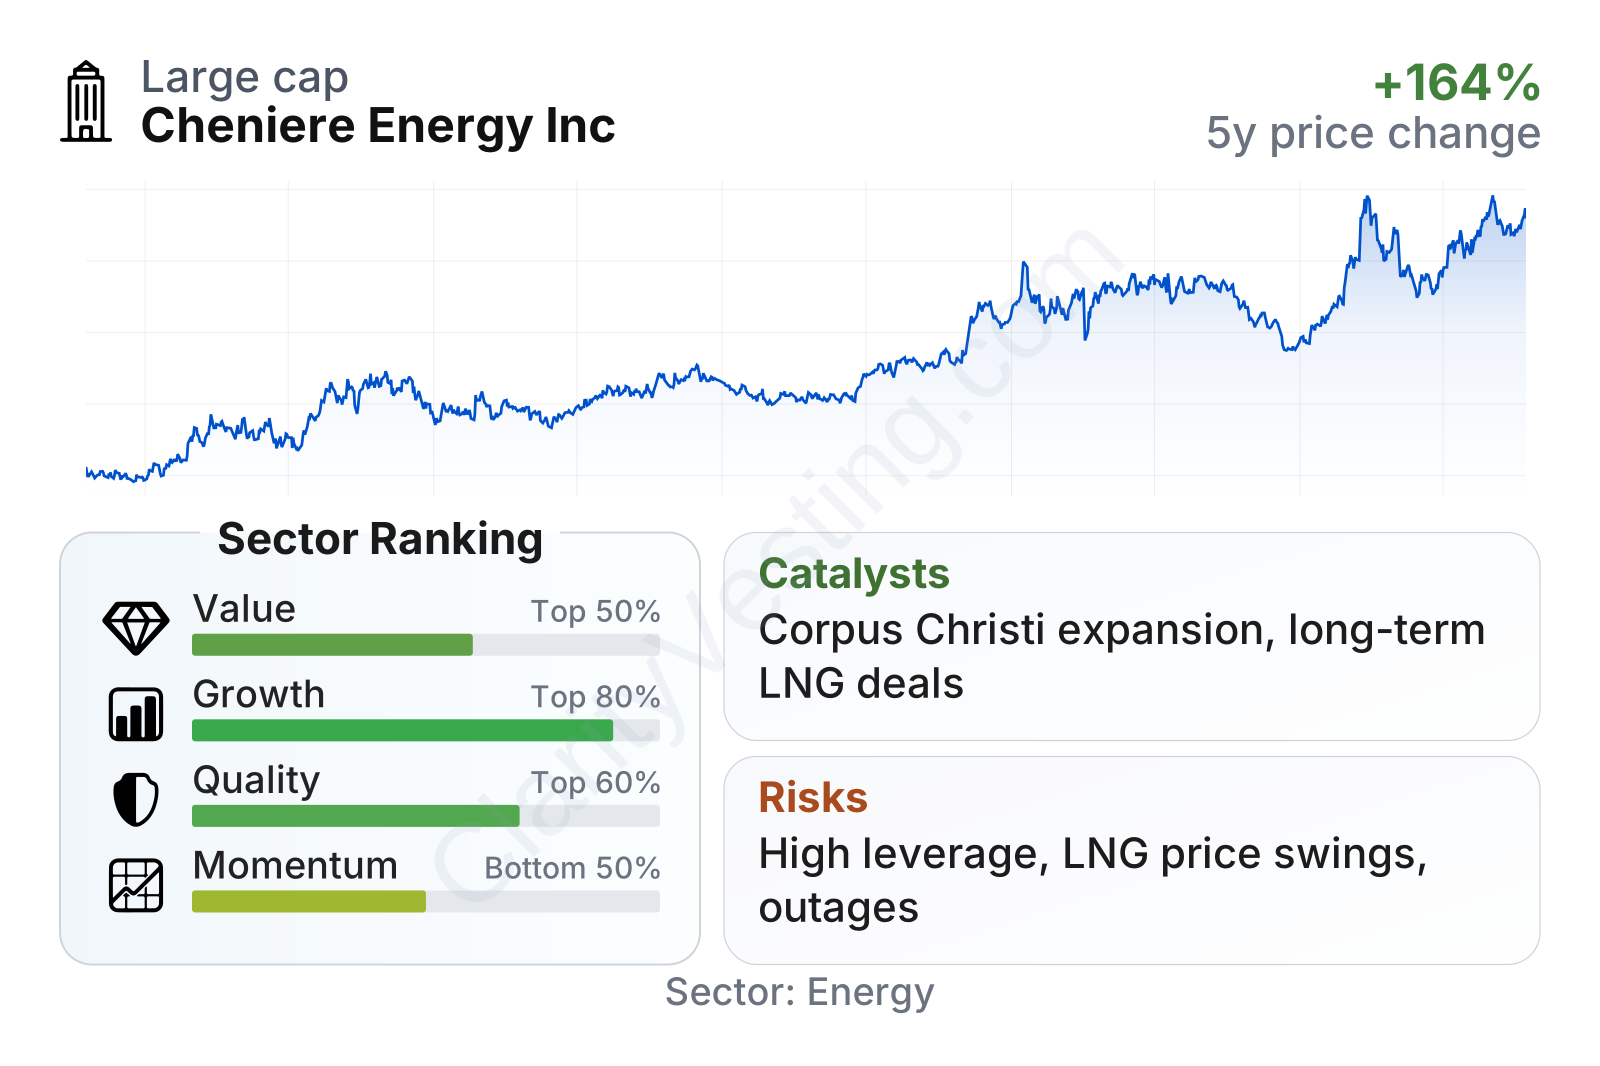
Cheniere is now a very large energy infrastructure company. The table points to a mixed but understandable profile: valuation is not especially cheap on simple earnings or book value measures, yet free cash flow yield looks strong and operating returns are above sector norms. Growth metrics are uneven because this business can post sharp swings in revenue and earnings depending on LNG prices, but margin improvement and free cash flow growth have been notable over a longer period.
The stock’s recent momentum has been less impressive than some peers over the last year, even though the longer multi-year share price trend remains strong. That often happens when the market pauses after a major run-up and starts weighing the next phase of expansion against the company’s already higher valuation.
Growth
Cheniere operates in a sector with structural support. Global LNG demand has been rising as countries look for flexible gas supply, energy security, and in some cases a fuel that can replace coal in power generation. Europe’s shift away from Russian pipeline gas, expanding Asian gas demand, and the broader build-out of LNG import capacity have all increased the strategic importance of U.S. LNG exports. Cheniere is positioned directly in the middle of that trend.
The company’s strategy for future growth is straightforward and sensible: expand liquefaction capacity, sign long-term contracts before building new trains, and use its existing operating platform to spread fixed costs across larger volumes. That model lowers project risk compared with a merchant-only approach. Cheniere has also been developing additional capacity at Corpus Christi and evaluating further brownfield expansion, which is often more attractive than starting entirely new export sites from scratch.
Revenue growth has been highly cyclical rather than smooth. There was an exceptional surge during the global LNG price shock, then a steep normalization phase, and more recently growth turned positive again. That pattern is normal for an LNG exporter whose reported sales reflect both physical volumes and commodity pricing. For long-term analysis, the more encouraging sign is that the business returned to positive growth after the reset instead of remaining in contraction.
Free cash flow has also been uneven, but the broader picture remains constructive. Even after dropping from the extraordinary highs seen during peak market conditions, cash generation remains substantial in absolute terms. For a capital-intensive business, that matters because it supports debt service, share repurchases, dividends, and new project funding without relying entirely on external financing.
A major catalyst is the next wave of capacity additions, especially the phased growth around Corpus Christi. When new trains start operating, Cheniere can increase contracted production and potentially lock in more fee-based earnings. Another favorable development is continued long-term contracting across the global LNG market, which strengthens visibility for future export volumes. The company has also been pushing into lower-emission LNG initiatives and supply-chain optimization, which may help preserve customer relationships as buyers place more weight on emissions tracking.
Risks
This article is for informational purposes only and does not constitute financial advice. Some content is AI-generated. See Disclaimer


